Keywordsbudget deficit Covid-19 pandemic debt-to-GDP ratio Economic recovery expenditure tax revenue
JEL Classification B22, E01, N10
Full Article
1. Introduction
The world economy has had major events that caused a series of economic and financial crises in the past. For example, during the twenty-first century, the world had to endure an economically turbulent time as in the two preceding centuries (Ross, 2021). Ross (2021) further elaborates that there were multiple financial crises that hit nations, regions, and, in the case of the Great Recession, the entire global economy during this time. It is argued that most financial crises share certain characteristics, but each with its own unique story to tell and lessons to learn. The 2007/8 financial crisis being the last one is now replaced by the Covid-19 pandemic. Singh (2022) is of the view that the 2007-8 financial crisis was years in the making and its impact was not limited to the United States of America where it all started; it devastated economies across the world, and it lasted for a number of years after the incident.
The Covid-19 pandemic has had a significant negative impact on people’s health and the world economy. The World Bank depicted a gloomy picture of the global economy in its Global Economic Prospects report as early as June 2020 in terms of its effects. The paper stated that despite unprecedented policy support, the COVID-19 epidemic has struck a crushing blow to an already fragile global economy, which is poised to sink into its greatest recession since the Second World War (World Bank, 2020). The report went on to explain that failure to implement the necessary measures promptly, financial strain brought on by the pandemic that prompts defaults by some nations, or the pandemic’s protracted negative effects on people and businesses could all contribute to the global economic downturn becoming worse.
There have been other pandemics in the past; Covid-19 is not the first of its kind. The influenza epidemics of the 20th century (1918, 1957, and 1968), which destroyed the world economy at the time due to its protracted economic problems, are among the major pandemics in history. The 1918 influenza pandemic (H1N1), which struck the world four years after World War I started in 1914, is thought to have had a significant negative impact on global health and claimed an estimated 50 million lives (Johnson and Mueller, 2002). Three significant pandemic waves followed after the outbreak (Simonsen, Chowell, Andreasen, Gaffey, Barry and Olson, 2018). According to Saunders-Hastings and Krewski (2016), the world economy at the time was destroyed by the war, and the period was characterized by trench warfare-related health services limitations, inadequate sanitation, and congestion. At the time, medical breakthroughs did not allow for the handling of such pandemics (Jester, Uyeki, Jernigan and Tumpey, 2019). The 1957’s H2N2 and 1968’s H3N2 pandemics also had their origins in Asia. In the winter of 1957, the H2N2 virus killed 1.1 million people worldwide, while the H3N2 influenza pandemic in 1968 is thought to have killed between one and four million people worldwide (Honigsbaum, 2020). Compared to the 1918 pandemic, these two outbreaks were less severe and had less of an impact (McDonald, Scott, Edmunds, Beutels and Smith, 2008).
As the title indicates the focus of this paper is on the impact of Covid-19 on the South African economy and the possible recovery in the immediate future. This study builds on a study conducted on the subject thus far (Redda, 2021), by incorporating additional variables and extending the research objective to include the projections of recovery of the South African economy in the aftermath of the Covid-19 pandemic.
2. Literature Review
2.1 Profile of the South African Economy
South Africa has Africa’s most developed economy. It was also the largest economy until 2014 when Nigeria took over. With a gross domestic product (GDP) of more than 302 USD, South Africa is currently ranked number 34 in terms of the size of its economy. The services sector, which includes finance, real estate, and business services, is the largest contributor in South Africa, accounting for roughly 73% of the country’s GDP, followed by manufacturing (13.9%), mining and quarrying (8.3%), and agriculture (2.6%). (2021, Trading Economics). South Africa, with a population of approximately 60 million people, is classified as an upper-middle-income country by the World Bank, with a GDP of more than $300 billion USD and a GDP per capita of 6748.23 USD. As the discussion focuses primarily on the impact of the Covid-19 pandemic, it is important to note that South Africa entered the pandemic with low levels of economic growth, high levels of unemployment and poverty, and the world’s highest income inequality as measured by the Gini-coefficient.
2.2 The Covid-19 Pandemic and the South African Economy
There is little doubt that the immediate impact of the South African government’s lockdown policies on household spending, exports, and investment, as well as the associated macroeconomic shocks, will have a wide-ranging impact (Arndt, Davies, Gabriel, Harris, Makrelov, Robinson, Levy, Simbanegavi, van Seventer and Anderson, 2020). As previously stated, the South African economy was already in the worst shape and form prior to the Covid-19 crisis. Tito Mboweni, South Africa’s finance minister at the time, predicted that the country’s GDP would fall by 7.2% in 2020, down from a slight expansion predicted in February, due to the ravages of the Covid-19 outbreak, the country’s worst contraction in 90 years (Mathe and Maeko, 2020).
The fiscal policy of any country is inextricably linked to its politics. This is due to the fact that such policies have a significant impact on resource redistribution across society, regions, and generations, and are frequently sources of conflict (Alesina and Passalacqua, 2015). Fiscal policy is influenced by macroeconomic variables such as government spending, tax revenue, and government debt. Policymakers, lenders, and borrowers are frequently challenged with determining the optimal level of debt-to-finance expenditure and development objectives (Naraidoo and Raputsoane, 2014). In the following section, key macroeconomic variables analysed in this study are discussed.
2.3 Description of Key Macroeconomic Variables
A country’s gross domestic product (GDP) is one of the primary indicators used to assess the performance of its economy. The term "economy" refers to the system that organizes a country’s trade, industry, and money. GDP is defined as the total value of all goods and services produced within a country’s borders over a specific time period, usually a year or a quarter. GDP can also be expressed as the total expenditures for all final goods and services produced during a given period which is equal GDP measures of national income and output for a specific country’s economy.
Public debt is defined as the total of all current liabilities plus accrued interest and principal, and the debt sustainability analysis depends on a dynamic analysis of the trajectory of the debt-to-GDP ratio that is stable over the medium term (Debrun, Ostry, Willems and Wyplosz, 2019). The economic literature on fiscal policy has traditionally focused on the development of an analytical framework to assess governments’ "ability to pay" debt over time, i.e., debt sustainability (Fournier and Fall, 2015). According to the conventional view of debt sustainability, debt is only maintainable if the solvency requirement is met, that is, if the public debt might be repaid at some point in the future (Giannini and Oldani, 2022). The debt-to-GDP ratio, expressed as a percentage of GDP, is used by investors to assess a country’s ability to make future debt payments, which influences borrowing costs and government bond yields.
A government budget, defined as an itemized accounting of payments collected by the government (taxes and other levies) and payments made by the government, is critical to both investors and governments (purchases and transfer payments). The annual government budget plan expresses the government’s fiscal policy by outlining government expenditures, tax revenues, and borrowing needs (Gounder, Narayan and Prasad, 2007). A budget deficit occurs when the government spends more money than it receives in tax revenues; a budget surplus is the inverse of a budget deficit, and when the two are equal, the budget is said to be balanced. Government revenue and government expenditure are the two most important factors in fiscal policy. Fiscal policy changes, such as changes in government revenue and expenditure proportions, have a direct impact on the budget deficit, whether from the expenditure, revenue, or both sides (Carneiro, Faria and Barry, 2004).
Prudent macroeconomic policy is defined as keeping the debt-to-GDP ratio and the fiscal deficit to acceptable levels. South Africa’s government claims that it is committed to maintaining a sustainable debt-to-GDP ratio while lowering debt payment costs. A generally accepted norm is that the debt-to-GDP ratio should not exceed 60% unless it is falling at a sustainable rate toward the stated goal and the government budget deficit is less than 3% of GDP (SADC, 2016; Darvas and Szapáry, 2008, 2010; Redda, 2020B). In most cases, countries do run budget deficits which are deemed acceptable as long as it does not exceed the threshold. According to Stats SA, there was a time South Africa enjoyed a budget surplus over a three-year period between 2005/6-2008/9 as depicted in Figure 1.
Figure 1: Government revenue and expenditure
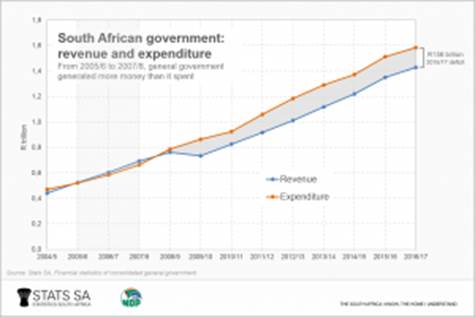
Sources: Stats SA, 2019
A rise in government spending as a percentage of GDP is said to be frequently associated with faster economic growth, but only up to a point (Forte and Maggazino, 2016). Government spending and GDP growth are negatively correlated as the ratio of government spending to GDP increases because higher levels of government spending have higher opportunity costs that lead to less efficient resource allocation in the economy (Asimakopoulos and Karavias, 2016; Hajamini and Falahi, 2018). In terms of fiscal consolidation, Dellepiane-Avellaneda and Hardiman (2015) argue that the mix of fiscal consolidation influences the scope and sustainability of deficit reduction efforts. Fiscal consolidation through spending cuts is thought to be more long-term because it is more likely to stimulate growth. The reasoning is based on non-Keynesian effects: whereas a Keynesian analysis would show that aggregate demand drives growth, this method suggests that private investor confidence drives growth.
3. Research Questions and Objectives
3.1 Research Questions
To guide this research, the following key research questions have been formulated:
- Question 1: How sustainable is government spending in light of tax revenues and economic growth in South Africa?
- Question 2: Given the projected budget deficit, how sustainable is South Africa’s debt-to-GDP ratio?
- Question 3: What is the recovery prospectus for the South African economy in the aftermath of the Covid-19 pandemic?
3.2 Purpose of the Study
The purpose of this study is firstly to assess the impact of the Covid-19 pandemic on the South African economy and secondly, to explore the recovery prospects in the aftermath of the pandemic. The key macroeconomic variables such as GDP, debt-to-GDP ratio and budget deficit/surplus are analysed to determine the impact of the Covid-19 pandemic and forecast recovery prospects of the South African economy.
4. Research Design and Method
The study adopted a descriptive research design and conducted quantitative analyses. Annual time-series data from 2000 to 2022, as well as projected data until 2026, were used for the analysis. This sample duration is sufficient for the type of analysis performed in this study and for achieving the research goal of the study. Government revenue, spending, GDP, and the debt-to-GDP ratio are among the macroeconomic factors considered for the study.
5. Presentation of Results and Discussion
5.1 The Discrepancy between General Government Revenue and Expenditure
Figure 2 depicts the discrepancy between general government revenue and expenditure, as well as the budget deficit or surplus for the specified period. According to the data, South Africa only maintained a budget deficit of less than 3% prior to the 2008/9 financial crisis. The budget deficit increased from 0.5% in 2008 to 5% in 2009, and it has remained between four and 5% ever since. This clearly demonstrates that the consequences of such crises are felt long after they have passed.
As shown in Figure 2, the biggest disparity between government revenue and expenditure was recorded in 2020 producing a budget deficit of about 10 per cent. There could be several reasons for the drop in government revenues and increase in government spending during the first year of the pandemic. For example, businesses were allowed to have access to tax relief measures, tax clearing status, tax debt payment arrangements, and a debt relief finance scheme for qualifying enterprises by the South African government. These measures which could be the primary reason for the drop in tax revenue collections. On the other hand, individuals who had previously received no form of assistance were eligible for the special COVID-19 social relief of distress grant of R350 per month. Coupled with an an increased government spending included rising healthcare and vaccination costs could have been the main reasons for higher levels of government expenditures. The outlook and projected recovery do not appear promising, and its impact may last for several years, as is typical of such crises (see Figure 2). The projection suggests that the budget deficit may continue to trend above the 3 per cent threshold in the short-to-medium term. This projection is in line with South Africa’s government revised budget deficit forecast for the fiscal year 2021/22 to 5.7 per cent of GDP from 7.8 per cent in November, owing primarily to higher-than-expected tax collections, namely higher mining receipts.
Figure 2: Discrepancy between general government revenue and expenditure
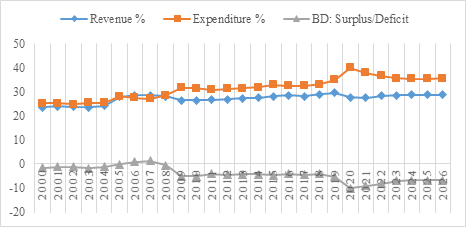
Source: Researcher’s construction
5.2 Debt-to-GDP ratio, GDP and Budget Deficit Outlook
It is critical to investigate the effects of deteriorating fiscal constraints on the country’s debt and economic growth. Figure 3 depicts the debt-to-GDP ratio, GDP, and budget deficit outlook and highlight their relationship. As can be observed, the debt-to-GDP ratio is way above the 60% threshold with a steeper positive slope, coupled with less encouraging economic growth, as evidenced by low GDP projections in the short run. This is due to the fact that what is not financed through tax revenues had to be financed through government borrowing, which inevitably raises the debt-to-GDP ratio as the country’s economic growth does not support its expenditure requirements. It should be noted that even before the pandemic in 2019, the debt-to-GDP ratio had surpassed the 60% mark, and is already showing negative trends with the pandemic’s effects beginning in 2020.
Figure 3: Debt-to-GDP ratio, GDP and budget deficit outlook
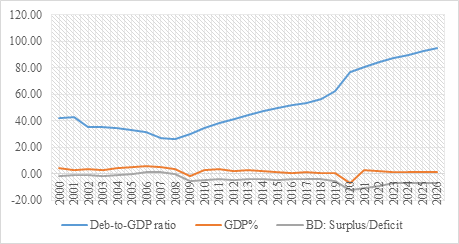
Source: Researcher’s construction
Table 1 shows the averages of government revenue, expenditure, budget deficit/surplus, and debt-to-GDP ratio over a 21-year period (2000-2021), as well as the actual figures for the five most recent years (2016-2020) and projected figures for the next five years (2021-2025). Tax revenue fell from 29.74 percent to 27.86 percent between 2019 and 2020, while expenditure increased from 35% to 40% during the same period. As a result, the budget deficit increased from 5.27 percent to 10 percent, multiple times exceeding the three percent threshold. The debt-to-GDP ratio rose above the threshold, from 62.15 percent to 70.07 percent.
Table 1: Averages and outlook of revenue, expenditure, budget deficit, debt-to-GDP ratio and GDP
| Macroeconomic variables | Past five years | Mean (21 yrs) | St.dev. | Five-year outlook | ||||||||
| 2016 | 2017 | 2018 | 2019 | 2020 | 2021 | 2022 | 2023 | 2024 | 2025 | |||
| Revenue % | 28.59 | 28.20 | 29.08 | 29.74 | 27.86 | 26.94 | 1.94 | 27.46 | 28.37 | 28.70 | 28.79 | 28.81 |
| Expenditure % | 32.66 | 32.59 | 33.20 | 35.01 | 40.11 | 30.14 | 3.91 | 38.06 | 36.63 | 35.75 | 35.47 | 35.51 |
| BD-Surplus/ Deficit % | -4.07 | -4.38 | -4.12 | -5.27 | 10 | -3.20 | 2.96 | -10.60 | -8.26 | -7.06 | -6.69 | -6.70 |
| Debt-to-GDP ratio | 51.47 | 53.02 | 56.71 | 62.15 | 70.07 | 42.52 | 12.55 | 80.78 | 84.35 | 87.21 | 89.88 | 92.53 |
| GDP% | 0.40 | 1.42 | 0.79 | 0.15 | -6.96 | 2.18 | 2.79 | 4.90 | 1.80 | 1.30 | 1.30 | 1.30 |
Source: Researcher’s construction
The forecasting models of Trading Economics (2022a; 2022b) also produced similar results; where in the long-term, the South African Government budget is projected to trend around -4.80 per cent of GDP in 2023 and -4.20 per cent of GDP in 2024, and Debt to GDP is projected to trend around 76.80 per cent of GDP in 2023 and 75.10 per cent of GDP in 2024.
The Covid-19 pandemic, combined with government restrictions, has devastated the South African economy. Several businesses were forced to close for weeks or even months, while others were forced to reduce their hours of operation or close permanently. These had a direct impact on unemployment, poverty, and government tax collection. As a result, the government’s potential tax revenue from businesses and individuals has been significantly reduced. In such a case, the South African government was forced to intervene in a variety of ways to assist businesses and individuals directly affected by the pandemic, which increased expenditures and widened the gap, resulting in a 10 per cent budget deficit.
However, the data released for the first quarter of 2022 do show some positive signs. South African economic activity has shown some recovery from the impact of the coronavirus disease 2019 (COVID-19) lockdowns in 2020, with real GDP increasing by 1.9 percent in the first quarter of 2022, following a revised increase of 1.4 percent in the fourth quarter of 2021. According to the South Africa Reserve Bank (2022) quarterly bulletin the secondary and tertiary sectors’ real gross value added (GVA) increased faster in the first quarter of 2022, while the primary sector contracted. In the first quarter of 2022, real GDP surpassed the average 2019 level for the first time, prior to the onset of the COVID-19 pandemic. Similarly, Stats SA (2022) also notes that South African GDP expanded by 1,9% in the first quarter of 2022, representing a second consecutive quarter of upward growth. The size of the economy is now at pre-pandemic levels, with real GDP slightly higher than what it was before the COVID-19 pandemic.
6. Conclusion and Recommendations
As elucidated in the analysis section, prior to the 2008/9 financial crisis, South Africa had a budget deficit of less than 3%. The budget deficit grew from 0.5 per cent in 2008 to 5% in 2009, and it has remained between 4% and 5% ever since. This clearly demonstrates that the consequences of such crises are felt long after they have passed. The greatest disparity between government revenue and expenditure occurred in 2020, resulting in a budget deficit of approximately 10%. The outlook and projected recovery appear bleak, and it may last for several years, as is typical of such crises. According to the projection, the budget deficit will remain above the 3% threshold for the short-to-medium term.
The study found that the debt-to-GDP ratio is significantly higher than the 60% threshold, with a steeper positive slope, coupled with less promising economic growth, as evidenced by low GDP projections. According to the projection, the debt-to-GDP ratio will remain above the 60% mark in the short run. This is because what is not covered by tax revenues had to be covered by government borrowing, which invariably raises the debt-to-GDP ratio as the country’s economic growth falls short of its spending needs. The 10% difference in government revenue and expenditure will have a long-term impact on the debt-to-GDP ratio through capital repayment and interest on borrowing.
However, based on recently released quarterly data, it seems that the South African economy is showing some signs of recovery from the effects of coronavirus disease 2019 (COVID-19) lockdowns in 2020, with real GDP increasing by 1.9 per cent in the first quarter of 2022, following a revised increase of 1.4 per cent in the fourth quarter of 2021. The real gross value added (GVA) of the secondary and tertiary sectors increased faster in the first quarter of 2022, while the primary sector contracted. Prior to the onset of the COVID-19 pandemic, real GDP surpassed the average 2019 level for the first time in the first quarter of 2022. South Africa’s GDP increased by 1.9% in the first quarter of 2022, marking the country’s second consecutive quarter of growth.
Fiscal sustainability requires keeping the debt-to-GDP ratio under control over the medium term by cutting spending and finding ways to increasing government revenues. Efforts should be made to reduce the budget deficit and improve spending composition, particularly by reducing wage bill increases.
---
Acknowledgements: The data were obtained from the website of Statistics South Africa.
Funding: This research was funded by the author`s institution (North-West University).
Conflicts of Interest: The authors declare no conflict of interest.
References
- Alesina, A. and Passalacqua, A., 2016. The political economy of government debt. Handbook of macroeconomics, 2, pp.2599-2651. doi: https://doi.org/10.1016/bs.hesmac.2016.03.014
- Arndt, C., Davies, R., Gabriel, S., Harris, L., Makrelov, K., Robinson, S., Levy, S., Simbanegavi, W., van Seventer, D. and Anderson, L., 2020. Covid-19 lockdowns, income distribution, and food security: An analysis for South Africa. Global Food Security, 26, pp.1-5. doi: https://doi.org/10.1016/j.gfs.2020.100410
- Asimakopoulos, S. and Karavias, Y., 2016. The impact of government size on economic growth: A threshold analysis. Economics Letters, 139, pp.65-68. doi: https://doi.org/10.1016/j.econlet.2015.12.010
- Carneiro, F., Faria, J. R. and Barry, B.S., 2004. Government revenues and expenditures in Guinea-Bissau: causality and cointegration. Journal of Economic Development, 30(1), pp. 107-117. Doi: https://doi.org/10.2139/ssrn.574143
- Darvas, Z. and Szapáry, G., 2008. Euro area enlargement and euro adoption strategies (No. MT-DP-2008/24). IEHAS Discussion Papers.
- Debrun, X., Ostry, J. D., Willems, T. and Wyplosz, C., 2019. Public debt sustainability. Sovereign Debt: A Guide for Economists and Practitioners. Washington D.C.: International Monetary Fund.
- Dellepiane-Avellaneda, S. and Hardiman, N., 2015. Fiscal politics in time: pathways to fiscal consolidation in Ireland, Greece, Britain, and Spain, 1980–2012. European Political Science Review, 7(2), 189-219. doi: https://doi.org/10.1017/S1755773914000186
- Fournier, J. and Fall, F.m 2015. Limits to government debt sustainability. doi: https://doi.org/10.1787/5jrxv0fctk7j-en.
- Giannini, B. and Oldani, C., 2022. Asymmetries in the sustainability of public debt in the EU: The use of swaps. The Journal of Economic Asymmetries, 26, e00248.
- Gounder, N., Narayan, P. K. and Prasad, A., 2007. An empirical investigation of the relationship between government revenue and expenditure: The case of the Fiji Islands. International Journal of Social Economics, 34(3), pp. 147-158. doi: https://doi.org/10.1108/03068290710726711
- Hajamini, M. and Falahi, M. A., 2018. Economic growth and government size in developed European countries: A panel threshold approach. Economic Analysis and Policy, 58, pp. 1-13. doi: https://doi.org/10.1016/j.eap.2017.12.002
- Honigsbaum, M., 2020. Revisiting the 1957 and 1968 influenza pandemics. Perspectives. 395, pp. 1824-126. doi: https://doi.org/10.1016/S0140-6736(20)31201-0
- Jester, B., Uyeki, T.M., Jernigan, D. B. and Tumpey, T.M., 2019. Historical and clinical aspects of the 1918 H1N1 pandemic in the United States. Virology. 527, pp.32-37. doi: Https://doi.org/10.1016/j.virol.2018.10.019
- Johnson, N.P., Mueller, J., 2002. Updating the accounts: global mortality of the 1918-1920 "Spanish" influenza pandemic. Bulletin of the History of Medicine, pp. 105-115. Doi: https://doi.org/10.1353/bhm.2002.0022
- Mathe, T and Maeko, T., 2020. SA’s economy expected to contract by 7.2% in 2020. [online] Available at: https://mg.co.za/business/2020-06-24-sas-economy-expected-to-contract-by-7-2-in-2020/ [Accessed 30 June 2022].
- McDonald, M., Scott, K. B., Edmunds, W. J., Beutels, P. and Smith, R. D., 2008. The Macroeconomic Costs of a Global Influenza Pandemic. In Global Trade Analysis Project 11th Annual Conference on Global Economic Analysis, "Future of Global Economy," Helsinki, June. [online] Available at: http://www.gtap.agecon.purdue.edu/resources/download/3828. pdf. [Accessed 30 June 2022].
- Naraidoo, R. and Raputsoane, L., 2015. Debt sustainability and financial crises in South Africa. Emerging Markets Finance and Trade, 51(1): pp. 224-233. doi: https://doi.org/10.1080/1540496X.2015.1011534
- Redda, E. H., 2020A. Sustainability of Public Debt and Budget Deficit In South Africa. Journal of Management Information and Decision Sciences, 23(3), pp.164-174.
- Redda, E. H., 2020B. Monetary union in SADC, evidence from panel-ARDL co-integration of public debt and budget deficit: lessons for the African Union. Journal of African Union Studies, 9(2), pp.107-122. doi: https://doi.org/10.31920/2050-4306/2020/9n2a6
- Redda, E.H., 2021. South Africa`s Fiscal Outlook Amidst Covid-19 Pandemic. 12th Business and Management Conference Proceeding 2021, Prague, Czech. p.84-98. doi: https://doi.org/10.20472/BMC.2021.012.010
- Ross, S., 2021. 3 Financial Crises in the 21st Century. [https://www.investopedia.com/articles/investing/011116/3-financial-crises-21st-century.asp; accessed 5 June 2022].
- SADC, 2006. SADC Protocol on Finance and Investment. [online] Available at: http://www.tralac.org/wp-content/blogs.dir/12/files/2011/uploads/20060621_finance_investment_protocol.pdf [Accessed on 5 June 2022].
- Saunders-Hastings, P.R. and Krewski, D., 2016. Reviewing the history of pandemic influenza: understanding patterns of emergence and transmission. Pathogens 5 (4). Doi:https://doi.org/10.3390/pathogens5040066
- Simonsen, L., Chowell, G., Andreasen, V., Gaffey, R., Barry, J. and Olson, D. 2018. A review of the 1918 herald pandemic wave: importance for contemporary pandemic response strategies. Annals of. Epidemiology. 28 (5), pp. 281-288. doi: https://doi.org/10.1016/j.annepidem.2018.02.013
- Singh, M. 2022. The 2007–2008 Financial Crisis in Review. [online] Available at: https://www.investopedia.com/articles/economics/09/financial-crisis-review.asp [Accessed on 5 June 2022].
- South African Reserve Bank, 2022. Quarterly Bulletin, June 2022.
- Stas SA, 2019. Government finances: surplus, deficit and debt. [online] Available at: https://www.statssa.gov.za/?p=11983&gclid=CjwKCAjwt7SWBhAnEiwAx8ZLapq9ZdDvOFfDUSmkBvrSfS9-tiMxE4l-Q8lyS9tRKjCIJQKOXI82vBoCPW4QAvD_BwE [Accessed on 5 May 2022].
- Stats SA, 2022. After two years, GDP returns to pre-pandemic levels. [online] Available at: https://www.statssa.gov.za/?p=15440; [Accessed on 5 May 2022].
- Trading Economics, 2020. South Africa GDP Growth Rate. [online] Available at: https://tradingeconomics.com/south-africa/gdp-growth [Accessed on 10 June 2021].
- Trading Economics. 2022a. South Africa Government Budget. [online] Available at: https://tradingeconomics.com/south-africa/government-budget [Accessed on 8 July 2022].
- Trading Economics. 2022b. South Africa Government Debt to GDP. [online] Available at: https://tradingeconomics.com/south-africa/government-debt-to-gdp#:~:text=Government%20Debt%20to%20GDP%20in,percent%20of%20GDP%20in%202008 [Accessed on 8 July 2022].
- World Bank. 2020. Global Economic Prospects, A World Bank Group Flagship Report, June 2020. [online] Available at: https://openknowledge.worldbank.org/bitstream/handle/10986/35647/9781464816659.pdf [Accessed on30 July 2020].
Article Rights and License
© 2022 The Author. Published by Sprint Investify. ISSN 2359-7712. This article is licensed under a Creative Commons Attribution 4.0 International License.
