Keywordsbusiness value comparative analysis cultural clusters global research MNCs Multinational Corporations
JEL Classification E22, L22, L10
Full Article
1. Introduction
This research project starts by analyzing carefully the most comprehensive list of Multinational Corporations (MNCs) on a worldwide basis which is published yearly by Forbes. The list contains the 2000 largest MNCs which operate globally. Also, the Forbes research ranks the companies taking into consideration 4 contributing variables to value which are: sales, profits, assets and market value, providing for researchers and executives a very insightful information on the evolution of MNCs. Still, and even if this research provides information about the representation of each country in terms of multinational the ranking it is possible to go beyond its information.
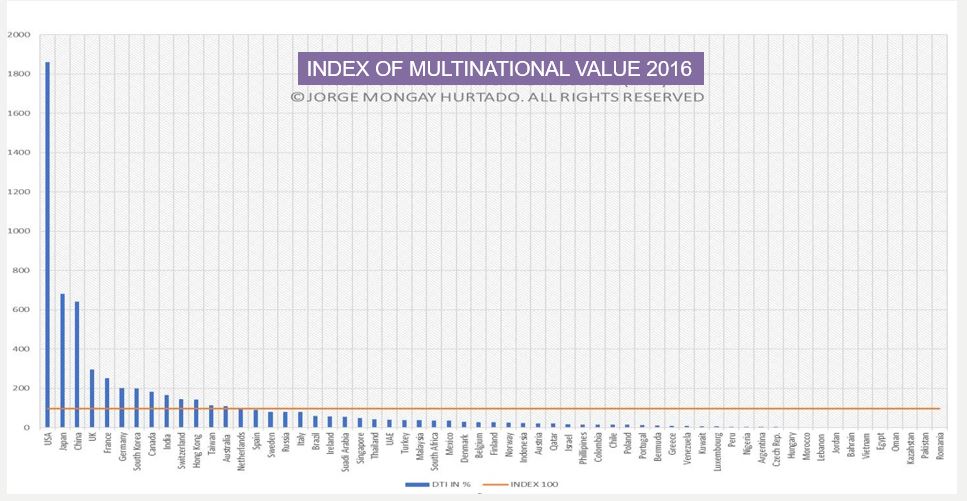
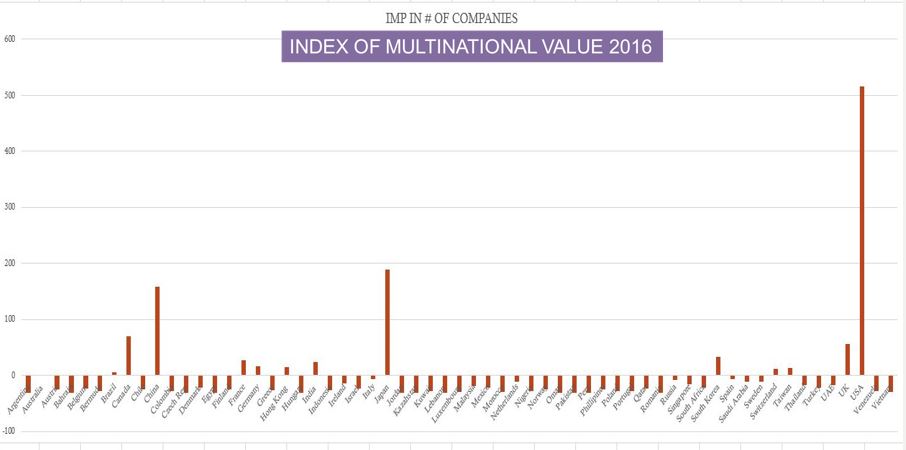
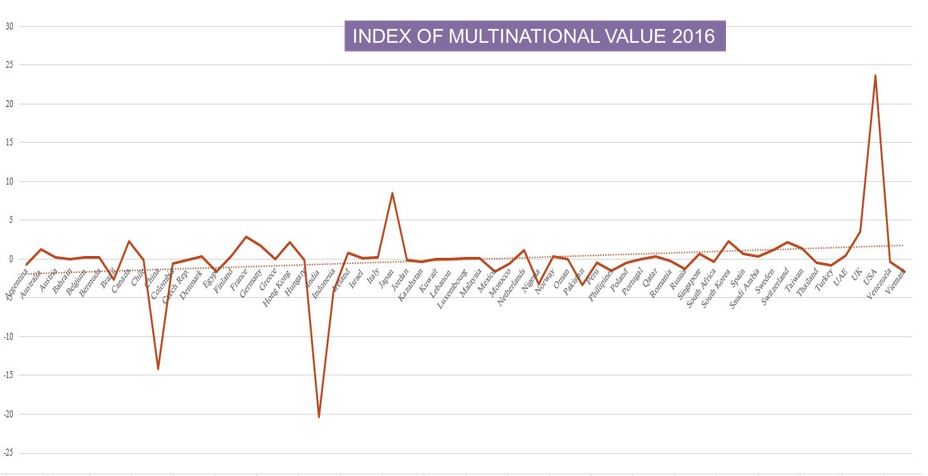
This work identifies and creates several indexes from the original raw data expressing the contributions to the global arena of MNCs in each participating country, showing results of 61 countries in total. First, this investigation assigns a value to each company depending on its position on the original ranking, taking as good the original methodology and the 4 variables used by Forbes. Second, the MNCs represented are grouped by nationality extracting information related to their industry of operation. Third, total values of the 61 countries represented are calculated and averages are made using a total of N=1923 corporations out of the original 2000 from the list. Fourth, averages are calculated out of the number of companies and value/country. Fifth, countries are grouped by cultural clusters following the Globe classification. Sixth, the countries are grouped by trading bloc. Seventh, The Distance to Index (DTI) indexes are calculated in terms of % of coverage of the average index stating how close or far away from the index 100% the country is located. For example, USA is a country which holds MNCs for a value of 18X (18 times) above the average value of the rest of the countries. Eighth, Also the DTI index in the number of companies is calculated per country. Ninth, the former general value of the MNCs of each country gets adjusted to its population. For example, a country like India performs very well in the index compared with other countries but not so well when we calculate the index taking into consideration its huge population and the opposite occurs in the case of Switzerland which is located in a very good position but it gets better when we adjust to its population the results of the index. Tenth, also it is presented in the research the presence of the services industry (usually represented by financial corporations) per country and its representation in value. The research has been based in a classification of MNCs during the year 2016.
2. Literature Review on Indexes Applied to International Business Research
Taking into account that this article creates an index, the literature review process has been based in firstly explaining the robustness of original raw data offered by the Forbes list and secondly a compilation of the most usual indicators, indexes and rankings used in international business analysis.
Forbes Global 2000 list (Forbes, 2017) is an annual ranking of the world’s biggest public companies along 4 major variables which are: sales, profits, assets, market value. Forbes ranking is considered by several academic sources and authors as most popular list when evaluation multinational presence and results. In order to create their list of the Top 2000 Multinational Companies (MNCs), Forbes sets limits for each of the four-metrics analyzed. Corporations must meet at least one of the criterion in order to appear in the classification of the top 2000. By doing this, the list is separated in 4 groups referring to sales, profits assets and market value. A given MNC could meet one criterion but not another one and still appear in the list.
Forbes obtains their “raw data” from FactSet Research systems (FRS), a multinational financial data and software company headquartered in Norwalk, Connecticut (CT), the United States that provides financial information and analytic software for investment professionals. Forbes ranks the corporations using a composite score which takes into account the former 4 variables or criterions. The list presents some limitations as it is restricted only to public companies. Also, the calculation of the composite-scores do not contemplate different weight in the metrics.
Forbes Global 200 list can be used as a platform for other research projects in economics or business as stated by (Wiegand et al, 2018), (Peng et al, 2016) or (Nowotnik et al, 2015).
Indexes and rankings are widely used not only in the study of macroeconomics but also in international trade and business in general offering easy to compare approaches. Also, indexes are widely used to help to understand the behavior of several countries and they are perceived as a great tool to be used in comparative economics.
Taking into consideration that this investigation wants to bring light to understanding the values of each country in MNC a research of indexes also called indicators is mentioned here. The Market Potentiality Index, (Cavusgill,1997) is a good example of using the indexing approach to explain the degree of potentiality or attractiveness of a country, economy or market. This one is also a composite index made by others variables as country size, market receptivity, market growth rate, market intensity, etc.
The Corruption Perceptions Index (Transparency International, 2017) it is a very valuable index in order to understand how countries perform in corruption offering a ranking close to 190 nations using a classification from o to 10 points.
The Ease of Doing Business (World Bank, 2017) is an index and ranking which explains how good and competitive governments are facilitating business on a day to day basis. It is important to state here the concept Distance to Frontier (DTF). The distance to frontier score helps assess the absolute level of regulatory performance over time. It measures the distance of each economy to the “frontier,” which represents the best performance observed on each of the indicators across all economies in the Doing Business sample since 2005. One can both see the gap between a particular economy’s performance and the best performance at any point in time and assess the absolute change in the economy’s regulatory environment over time as measured by Doing Business. An economy’s distance to frontier is reflected on a scale from 0 to 100, where 0 represents the lowest performance and 100 represents the frontier. For example, a score of 75 in 2017 means an economy was 25 percentage points away from the frontier constructed from the best performances across all economies and across time. A score of 80 in 2018 would indicate the economy is improving (World Bank, 2017).
The Global Competitiveness Report 2017-18 (World Economic Forum, 2017), states using a composite index and a ranking the levels and the evolution of the concept competitiveness selecting 12 different pillars as infrastructure, institutions or innovation among others.
In order to better understand how connected an economy or country exists the DHL Global Connectedness (Gheadas and Altman, 2016). This indicator provides a comprehensive idea of the global amount of connectedness and it covers up to 140 nations. The represented nations represent up to 99% of the Global Gross Domestic Product and 95% of it’s the worldwide population. The idea used here if that “global connectedness” is comprised by 4 main pillars of the index which are a) Trade flows (products and services), b) investment flows (capital), c) information flows, and d) people flows.
Culture and cultural dimensions also have been ranked through indexes by (Hofstede, 2017) helping to researchers to understand differences among countries and how employees behave taking into consideration 6 crucial variables. The Gini index also is another example of utilization of indicators, in this particular case it measures income distribution and wealth distribution among a population (Gini, C. 1921). The coefficient ranges from 0 (or 0%) to 1 (or 100%), with 0 representing perfect equality and 1 representing perfect inequality. so, relevant the Global Innovation Index (Cornell University, INSEAD, and the World Intellectual Property Organization, 2017) provides specific metrics about the innovation performance of 127 countries and economies around the world. It is made by 81 robust indicators which offer a panoramic vision of the topic. The Index of Economic Freedom (Heritage Foundation, 2017) measures data based on 12 quantitative and qualitative factors, grouped into four broad categories, or pillars, of economic freedom: Rule of Law (property rights, government integrity, judicial effectiveness), Government Size (government spending, tax burden, fiscal health), Regulatory Efficiency (business freedom, labor freedom, monetary freedom) and Open Markets(trade freedom, investment freedom, financial freedom). The Indigo score (Global Perspectives, 2017) states that in order to measure a country’s ability to compete and grow in this new economic era, it is vital to look at a range of broader socio–economic infrastructure such as; the levels of education, the ‘cloud’ or infrastructure for doing business, its legal system, physical and intellectual property rights, competitive environment, political stability, digital infrastructure, and the ecosystem of thousands of suppliers that can provide high-quality services ranging from venture financing to marketing and web design. To assess a country’s future potential the indicator provides information of a country’s socio-economic infrastructure that will shape, and influence, its economic performance in the new Indigo Era. The score is based on five dimensions (Global Perspectives, 2017):
1) Stability & Legal Framework,
2) Creativity & Innovation,
3) Economic Diversity,
4) Digital Economy and
5) Freedom
3. Methodology and Index Dimensions
Initially, the secondary data research discards from the list of the 2000 corporations (Forbes, 2017) a total of 77 companies due to their lack of consistency and irregularities in the raw data taking this research to a total of 1923 companies representing 96.15% of the Forbes database.
Companies have been given a value according to their position in the original ranking so the first company of the list was in position #1 obtaining 1923 points, #2 obtained 1922 points, etc. until the last company in the list which obtains 1 point. See equation where VM(abs) refers to the absolute value of each multinational company analyzed, ∑c refers to the total number of analyzed companies, in this case 1923 and #r refers to position in the ranking.
VM(abs)= ∑c - #r
Consequently, it is possible to obtain a list of 1923 companies ordered by value according to their position in the original ranking. See in Table 1 the top 10 companies of the research and their values.
Table 1. Top 10 MNC Globally
| MNC NAME | Country |
| ICBC | China |
| China Construction Bank | China |
| Agricultural Bank of China | China |
| Berkshire Hathaway | United States |
| JPMorgan Chase | United States |
| Bank of China | China |
| Wells Fargo | United States |
| Apple | United States |
| ExxonMobil | United States |
| Toyota Motor | Japan |
Source: Own elaboration
1.1. Secondly, the 1923 corporations analyzed have been grouped by country and information related to the industry of each company has been extracted and organized as well.
1.2. As third step, each one of the 61 countries of the list presents a total number of companies and their MNC value, for example Argentina has 2 companies in the classification and the value of the companies is 1173 and 140 respectively, giving a sum of 1313 in total. After adding all 61 countries we can state an average 30.236,57 weighted value per country. The equation used to calculate each country value (OV/C) is the total number of represented companies (#c) multiplied by the value of each company (vc), see the following equation.
OV/C= #c X vc
The average of 30.236,57 will be represented by the technical index 97.87 (although in order to understand it better is converted to 100%). If we keep on using the example of Argentina which has 2 companies with a total value of 1313 this represents 4.34% over the average 100%. The calculation is as follows: IMV(v)= Average value of the country / total average. So, Argentina which appears in the ranking and it is represented in value and number of companies, it covers only 4% of the average, being a 96% far away from it.
1.3. The fourth step obtains the number of companies which each country has in the list (global average is 32,62 companies). With this data, we can understand the implications of the number of companies that any country should add to its actual number to make it to the average or the number of companies which already exceed the average.
1.4. The fifth step consists in grouping the countries by cultural clusters in order to obtain information about a new classification and explore future inter-dependencies. The cluster classification follows the Globe Cluster Project due to its consistency and robustness. Clusters obtained and expressed in the index are: Cluster #1: South Asia, Cluster #2: Latin America, Cluster #3: Nordic, Cluster #4: Anglo, Cluster #5: Germanic, Cluster #6: Latin European, Cluster #7: African, Cluster #8: Eastern Europe, Cluster #9: Middle East and Cluster #10: Confucian Asia.
1.5. The sixth step refers to the same as before but classifying the countries and their corporations according the variable Trading Bloc (TB). In this aspect the trading blocs which appear are TB #1: NAFTA, TB#2: EU-27, TB#3: Mercosur, TB#4: ASEAN, TB#5: Others.
1.6. The seventh step relates to the calculation of the Distance to Index (DTI) which reflects the % of coverage of the index, for example Australia presents a value here of 1.09 (in reference to an index of 1), this states that the country is a 9% above the average.
1.7. The eighth step refers to the DTI index. It is calculated with absolute numbers, reflecting the average companies represented in the study and the number of companies of each country. For example, Spain shows a DTI in number of companies (DTI#c) of -6.62, this means that taking the average of 32 companies per country Spain is represented in the list with 26 companies, so at the moment that the country adds 6 or 7 more companies will achieve the average in number of MNCs. The DTI(#c) is also calculated in % of coverage of the average, for example Spain covers a total of 91.11% so it is very close to the total average of the 61 nations. Other countries like for example Chile, with only one company represented cover only 15% of the index, so still the country will have to walk a long way to achieve the average meaning that 85% of the way has not been covered yet.
1.8. The ninth step refers to the Index of Multinational Value adjusted to population (IMV-p). We can think that a country has more MNCs than the rest of the countries and this could be interpreted as a good sign or as a sign of economic power but it is easy to understand that the wealth of these corporations come from a country where population matters. So, this is a second interpretation of the index very valuable to better understand the impact of the economies in the MNCs and the global creation of wealth. If we take Switzerland as an example we can see that its IMV general index is 142% (so the country performs above the average a 42%), this occurs because Switzerland has 11 companies more than the average number. But, when considering population, the position of Switzerland improves a lot obtaining an Index adjusted to population (IMV-p) of 2.13, which means that the country performs a 213% above the average (which is represented here by zero (0).
1.9. Finally, and after evaluating all industries and coding them according to the Harmonized System (HS) codes we can state the contribution of each country of the list in terms of number of companies and value depending on its industry. Here, two big groups are made: Group 1: Industrial Corporations. All those corporations which operate in any industrial area manufacturing and selling products mainly, and Group
2. The Services and Financial Sector. It is used to HS code 16 to refer to “services”.
This analysis gives the possibility to understand the differences and contributions between the “productive economy” of each country and its implications in the global arena and the “financial economy” or “services economy”. The code 16 includes services, although most of the corporations in the list are included in the financial industry.
4. Results of the Research and Index Values
Table 2. Results of the Index of Multinational Value
| Country |
IMP(v) VALUE |
DTI IN #COMP |
INDEX ADJ WITH POPUL. |
Index of penetration % in companies in services |
Index of Penetration in % in value of services |
| Argentina | 4.34242376 | -30.623 | -0.690861721 | 50 | 10.66260472 |
| Australia | 106.9268108 | 1.377 | 1.299086631 | 61.76470588 | 65.97692617 |
| Austria | 21.44092402 | -24.623 | 0.194052254 | 62.5 | 63.45170247 |
| Bahrain | 1.987659315 | -30.623 | 0.006295412 | 100 | 100 |
| Belgium | 28.08519617 | -23.623 | 0.254449741 | 33.33333333 | 34.34997645 |
| Bermuda | 11.33726478 | -27.623 | 0.180880903 | 80 | 82.3512252 |
| Brazil | 58.85257488 | 5.377 | -2.651015786 | 15.78947368 | 40.40460804 |
| Canada | 178.5023897 | 69.377 | 2.235039191 | 22.54901961 | 50.18620421 |
| Chile | 15.10422644 | -25.623 | -0.067736247 | 57.14285714 | 45.28136632 |
| China | 627.7894616 | 158.377 | -14.14155027 | 49.7382199 | 59.17491123 |
| Colombia | 15.34234869 | -27.623 | -0.596652783 | 80 | 73.59344686 |
| Czech Rep. | 3.88933004 | -31.623 | -0.119868739 | 0 | 0 |
| Denmark | 29.24934938 | -22.623 | 0.370880662 | 20 | 25.29398462 |
| Egypt | 1.898363472 | -31.623 | -1.64540332 | 100 | 100 |
| Finland | 27.50642682 | -24.623 | 0.346522363 | 37.5 | 50.22243597 |
| France | 247.2833393 | 27.377 | 2.851621691 | 43.33333333 | 42.58392403 |
| Germany | 196.5037701 | 15.377 | 1.742382739 | 39.58333333 | 35.40628787 |
| Greece | 9.825849956 | -26.623 | -0.03389147 | 83.33333333 | 90.94580949 |
| Hong Kong | 140.9352979 | 14.377 | 2.134930903 | 55.31914894 | 52.98024124 |
| Hungary | 3.707431101 | -30.623 | -0.107497608 | 50 | 46.83318466 |
| India | 162.7830141 | 24.377 | -20.39455798 | 56.14035088 | 52.71840715 |
| Indonesia | 22.90603729 | -26.623 | -4.167686915 | 83.33333333 | 91.98671672 |
| Ireland | 57.06004352 | -14.623 | 0.833780304 | 44.44444444 | 53.35304005 |
| Israel | 17.60781729 | -23.623 | 0.139591886 | 88.88888889 | 68.51990984 |
| Italy | 77.80644432 | -6.623 | 0.228835228 | 73.07692308 | 67.33826405 |
| Japan | 666.6629184 | 189.377 | 8.506869073 | 40.99099099 | 36.60802873 |
| Jordan | 2.103413185 | -31.623 | -0.132891229 | 100 | 100 |
| Kazahstan | 0.618456392 | -31.623 | -0.302744081 | 100 | 100 |
| Kuwait | 7.229656009 | -28.623 | 0.045051715 | 100 | 100 |
| Lebanon | 2.923612037 | -30.623 | -0.057540849 | 100 | 100 |
| Luxembourg | 7.170125447 | -29.623 | 0.114189014 | 33.33333333 | 1.706642066 |
| Malaysia | 37.47118142 | -19.623 | 0.058025664 | 61.53846154 | 62.37422771 |
| Mexico | 36.1019785 | -21.623 | -1.63963548 | 36.36363636 | 40.12458776 |
| Morocco | 3.108818229 | -29.623 | -0.563942282 | 100 | 100 |
| Netherlands | 91.7498248 | -10.623 | 1.179601075 | 45.45454545 | 41.08932305 |
| Nigeria | 5.152700852 | -28.623 | -3.196551781 | 100 | 100 |
| Norway | 25.06898104 | -24.623 | 0.311191911 | 50 | 52.24274406 |
| Oman | 1.726386293 | -31.623 | -0.051840568 | 100 | 100 |
| Pakistan | 0.585383858 | -30.623 | -3.375147039 | 50 | 97.74011299 |
| Peru | 5.159315359 | -30.623 | -0.469710172 | 100 | 100 |
| Phillipines | 15.38534298 | -24.623 | -1.555439837 | 37.5 | 34.35081685 |
| Portugal | 12.8982884 | -27.623 | 0.029666243 | 40 | 17.48717949 |
| Qatar | 21.25902508 | -23.623 | 0.295928752 | 88.88888889 | 86.37212197 |
| Romania | 0.492780762 | -31.623 | -0.278475919 | 100 | 100 |
| Russia | 78.07433184 | -8.623 | -1.22077027 | 20.83333333 | 18.850341 |
| Singapore | 48.71253585 | -16.623 | 0.683691908 | 66.66666667 | 69.98067693 |
| South Africa | 36.25411216 | -21.623 | -0.39253726 | 56.25 | 68.21237015 |
| South Korea | 195.5876609 | 33.377 | 2.262482204 | 45.45454545 | 54.01386608 |
| Spain | 89.17016712 | -6.623 | 0.634505363 | 45.45454545 | 36.40575593 |
| Saudi Arabia | 53.05826686 | -11.623 | 0.285622496 | 57.69230769 | 58.11512499 |
| Sweden | 79.0929659 | -10.623 | 1.098834175 | 45.45454545 | 52.61969475 |
| Switzerland | 142.228434 | 11.377 | 2.13661059 | 52.27272727 | 51.03360074 |
| Taiwan | 110.8161409 | 13.377 | 1.372315843 | 41.30434783 | 42.47172233 |
| Thailand | 42.28323517 | -17.623 | -0.50744903 | 46.66666667 | 45.81149785 |
| Turkey | 38.09625232 | -21.623 | -0.775803444 | 81.81818182 | 75.98749891 |
| UAE | 40.35510642 | -17.623 | 0.486028802 | 86.66666667 | 89.01819374 |
| UK | 290.0494335 | 55.377 | 3.517036286 | 54.54545455 | 49.12144673 |
| USA | 1819.105143 | 516.377 | 23.61448683 | 43.35154827 | 41.51208559 |
| Venezuela | 9.124712228 | -28.623 | -0.402819427 | 100 | 100 |
| Vietnam | 1.924821499 | -29.623 | -1.610447928 | 100 | 100 |
4.1. Comments of the Results
Only 13 countries out of the 61 represented are above the average, these ones are as follows: Australia, Canada, China, France, Germany and Hong Kong, India, japan, South Korea, Switzerland, Taiwan, UK and USA. It is important to state that the USA is the most important country in the list with 18 times (18X) the average followed by Japan and China which have a value of 6X the average.
Also, it is important to mention a group of three countries which are in the average or very close to it as Sweden, Netherlands and Spain. The rest 45 countries perform below the average.
1.10. Analysis of Cultural Clusters and Trading Blocs
Table 3. Results split by Trading Blocs.
| Trading Bloc number | Trading Bloc | Results respect the index 100% | Countries represented |
| 1 | NAFTA | 692.65% | Canada, USA, Mexico |
| 2 | EU27 | 56.62% |
Austria, Belgium, Czech. Republic, Denmark, Finland, France, Germany, Greece Hungary, Ireland, Italy, Luxembourg, Netherlands, Poland, Portugal, Romania, Spain, Sweden. |
| 3 | Mercosur | 32.2% | Argentina, Brazil |
| 4 | ASEAN | 28.72% |
Indonesia, Philippines, Thailand, Singapore, Malaysia, Vietnam |
| 2. | Rest of the world | 90.54% |
Australia, Bahrain, Bermuda, Chile, China, Colombia, Egypt, Hong Kong, India, Israel, Japan, Jordan, Kazakhstan, Kuwait, Lebanon, Morocco, Nigeria, Norway, Oman, Pakistan, Peru, Qatar, Russia, South Africa, South Korea, Saudi Arabia, Switzerland, Taiwan, Turkey, UAE, UK, Venezuela. |
Table 4. Results based on cultural cluster
| Cluster number | Cluster denomination |
Average results of all participating countries in the cluster respect the index 100% |
Countries represented |
| 1 | South Asia | 48.38% |
India, Indonesia, Malaysia, Philippines, Singapore, Thailand, Vietnam |
| 2 | Latino American | 21.02% |
Argentina, Brazil, Chile, Colombia, Mexico, Peru, Venezuela. |
| 3 | Nordic | 41.10% | Sweden, Finland, Denmark, Norway |
| 4 | Anglo | 501% | Australia , Canada, Ireland, UK, USA |
| 5 | Germanic | 112.98% | Austria, Germany, Netherlands, Switzerland |
| 6 | Latino European | 80.52% |
Belgium, France, Israel, Italy, Portugal Spain. |
| 7 | African | 21.15 | Nigeria, South Africa |
| 8 | Eastern European | 26.32% | Greece, Kazakhstan, Poland, Russia |
| 9 | Middle East | 12.33% |
Bahrain, Egypt, Jordan, Kuwait, Lebanon, Morocco, Oman, Qatar, Turkey, UAE |
| 10 | Confucian Asia | 355.93% |
China, Hong Kong, Japan, South Korea, Taiwan |
5. Limitations of the index
The index is limited to the Forbes 2000 Global list of MNCs. It does not take into account neither other MNCs operating in the global market nor small and medium sized companies (SMEs) which operate internationally. Implicitly the “value” of the companies it is expressed in the original list taking into consideration the 4 variables: sales, profits, market value and assets but does not take into account other potentially strategic issues which could contribute to the idea of value, as for example, business core, source of the competitive advantage or evolution of markets.
6. Conclusions
The study reveals some interesting issues as:
1st: Only, only 61 countries out of the 198 nations-state in the world have presence in the analyzed list of the largest MNCs meaning this just a 30% of the total countries in the world.
2nd, According to the distribution of the trading zones, NAFTA presents results in value 7 times higher value than the average, while the group of countries (pushed by the USA mainly), “Rest of the World category” represented by a total of 32 countries covers 90% of the index, while the 18 countries of the EU covers only 56%, so less participation than expected of the EU-27, which questions today´s hegemony of the EU as one of the Top 3 top territories of GDP ( together with USA and China). It will be important to follow its evolution longitudinally in the future.
3rd, Two cultural clusters dominate the multinational value and the index. The “Anglo” cluster, represented by only 5 nations is five times higher than the average and the “Confucian Asian” cluster which is 3.5 times higher with also only 5 countries. Two other clusters are significant but at a lower level, these are the Latino-European (90% of the index) and Germanic (112%).
3rd, The Global index of value obtained is dominated by only 11nations which perform significantly above the average 4 of them are in the European Space (Germany, France, Switzerland and UK), 2 of them are in North America ( USA and Canada) , and others in Asia (China, India, Japan and South Korea) and Australia.
4th, If we analyze the same index adjusted to population some the values change significantly, for example we can see that India and China disappear from the list and Sweden goes to the top, suggesting that still there is a lot of potentiality for improvement in countries with high population and that population does not always contribute to the development and sustainability of the value of MNCs. The scores of small nations as Switzerland or Singapore explain that MNCs, their value and number is still important in the international arena questioning the growth of the highly populated countries.
5th) According to the results related to the penetration of services and financial corporations we have to state that 61.80% of the total MNCs operate in this sector.
Appendices
Annex 1. IMV Results Year 2016
Annex 2. IMV(#c) number of companies
Annex 3. IMV(p) Adjusted to population
Annex 4. IMV related to services
Annex 5. MAP illustration of the IMV
Annex 6. Map illustration of the IMV (p) adjusted to population
References
- Cavusgill, S.T., 1997. Measuring the potential of emerging markets: An indexing approach. Business Horizons. Volume 40, Issue 1, pp.87-91.
- Cornell University, INSEAD and the World Intellectual Property Organization, 2017. The Global Innovation Index. [online] Available at: https://www.globalinnovationindex.org/ [Retrieved in December 12th, 2017].
- Fitch ratings, 2017. Retrieved in December 6th, 2017 from the website https://www.fitchratings.com/site/home
- Ghemawat, P. and Altman S.A., 2016. The DHL Global Connectedness Index 2016. [online] Available at: http://www.dhl.com/content/dam/downloads/g0/about_us/logistics_insights/gci_2016/DHL_GCI_2016_full_study.pdf [Retrieved in December 10th, 2017].
- Gini, C., 1921. Measurement of Inequality of Incomes. The Economic Journal, 31(121), pp.124-126.
- Hofstede, G., 2017. The &-D model of national culture. [online] Available at: http://geerthofstede.com/culture-geert-hofstede-gert-jan-hofstede/6d-model-of-national-culture/ [Retrieved in December 6th 2017].
- LetterOne Investments, 2017. Global Perspectives. Indigo Score. [online] Available at: http://global-perspectives.org.uk/indigo-score/map/ [Retrieved in December 7th, 2017].
- Nowotnik, D. and Razniak, P., 2015. Pozycja gospodarcza miast Europy Środkowo-Wschodniej na tle świata / The Economic Position of Central-Eastern European Cities Against the Background of the World. International Economics, issue 9, pp. 23-39.
- OECD, 2016. OECD Ratings 2016. [online] Available at: http://www.oecd.org/tad/xcred/crc.htm [Retrieved in December 6th, 2017].
- OECD, 2017. The FDI Regulatory Restrictiveness Index (FDI Index) [online] Available at: http://www.oecd.org/investment/fdiindex.htm [Retrieved in December 20th, 2017].
- Peng, S.-S., Huang, D.-S., Yang, T.-H. and Sun, Y.-C., 2016. Who's in the Forbes Global 2000? The Role of Home Market, Multinational Firms and Economic Development. Review of Development Economics, 20(1), pp. 101-112.
- Standard and Poor´s, 2017. S&P Global Ratings. [online] Available at: https://www.standardandpoors.com/en_US/web/guest/home [Retrieved in December 12th, 2017].
- The Heritage Foundation 2017. Index of Economic Freedom. [online] Available at: https://www.heritage.org/index/ [Retrieved in December 15th, 2017].
- The World Bank Group, 2017. Doing Business report 2017. [online] Available at: www.doingbusiness.org [Retrieved in November 8th, 2017].
- The World Economic Forum, 2017. The Global Competitiveness Report 2017-2018. [online] Available at: https://www.weforum.org/reports/the-global-competitiveness-report-2017-2018 [Retrieved in December 15th, 2017].
- Transparency International, 2017. Transparency International. [online] Available at: www.transparency.org [Retrieved at December 10th, 2017].
- United Nations, 2017. UN data, a world of information, 2017. [online] Available at: http://data.un.org/ [Retrieved in December 22nd, 2017].
- Wiegand, M. and Nadarajah, S., 2018. New composite distributions for modeling industrial income and wealth per employee. Physica A: Statistical Mechanics and its Applications, 492, issue C, pp. 1901-1908.
Article Rights and License
© 2018 The Author. Published by Sprint Investify. ISSN 2359-7712. This article is licensed under a Creative Commons Attribution 4.0 International License.
