Keywordsconsumption Economic Growth GDP Inflation investment
JEL Classification E20
Full Article
1. Measuring Romania’s Wellbeing in the Region
Gross domestic product is the indicator used in international statistics to describe the economic development of a country.Even though Romania’s economic growth has slowed down in the last year, it still remains at a high level (Figure 1). Over the last five years (2014-2018), Romania recorded the fastest growth rate among the CESE-6 countries (6 EU countries in Central and South-Eastern Europe that have not yet adopted euro: Bulgaria, Czech Republic, Croatia, Poland, Romania and Hungary) (Figure 2). Its GDP reached € 202.9 billion in 2018, ranking third among CESE-6 countries after Poland (€ 496.4 billion) and Czechia (€ 207.8 billion) and 15th in the European Union (Eurostat, Code: tec00001).
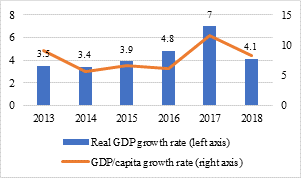
Figure 1. Romania’s economic growth (%)
Source: Eurostat, Codes: tec00001, tec00115
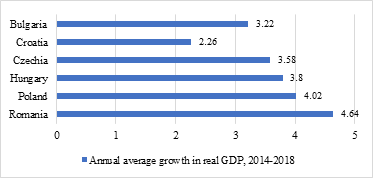
Figure 2. Annual average growth in real GDP (%), 2014-2018
Source: Eurostat, Code: tec00115
Despite of these performances, in terms of GDP per capita, Romania is ranked on the penultimate place in European Union, registering in 2018 a value of 10,400 euro, outpacing only Bulgaria (Eurostat, Code: tec00001). However, GDP is a limited measure of economic welfare as it does not really show how well people live and how good the quality of the environment is.Thus, international organizations have sought to develop indicators that include environmental and social aspects of progress. The United Nations Development Program (UNDP) developed the Human Development Index (HDI) a statistic composite index that captures human progress, combining information on people’s health, education and income in just one number between 0 and 1.
Table 1. Human Development Index and its components
|
Human Development Index (HDI) (value) -2017- |
Life expectancy at birth (years) -2017- |
Expected years of schooling (years) -2017- |
Mean years of schooling (years) -2017- |
HDI rank -2016- |
|
| Bulgaria | 0.813 | 74.9 | 14.8 | 11.8 | 50 |
| Croatia | 0.831 | 77.8 | 15.0 | 11.3 | 46 |
| Czechia | 0.888 | 78.9 | 16.9 | 12.7 | 27 |
| Hungary | 0.838 | 76.1 | 15.1 | 11.9 | 45 |
| Poland | 0.865 | 77.8 | 16.4 | 12.3 | 34 |
| Romania | 0.811 | 75.6 | 14.3 | 11.0 | 52 |
Source: UNDP, Human Development Indices and Indicators, 2018
CESE-6 countries fall into the category of ‘very high human development’, which included 59 countries in 2017, but are below the average of 0.894.Even though Romania’s HDI value has increased from year to year, among CESE-6 countries occupies the last position, being ranked 52nd out of a total of 188 countries and territories. Analyzing the HDI coefficient, we notice that Romania has registered the weakest performances in the education sector, one for which it allocates the smallest percentage of GDP in the European Union (Figure 3). The most affected are the preprimary and primary levels of education, which should be the key to preventing early school leaving, ensuring equal opportunities and tackling inequalities later in life. As a consequence, early school leaving in Romania is the highest among CESE-6 countries and in the European Union, only Malta and Spain register weaker performances. In 2018, the early school leaving rate in Romania was 16.4% (Eurostat, Code: edat_lfse_14), and although it shrinks, it’s still way above the 2020 national target of 10%. The weak performance of the education system is one of the reasons why Romania has difficulties in catching up with the EU.
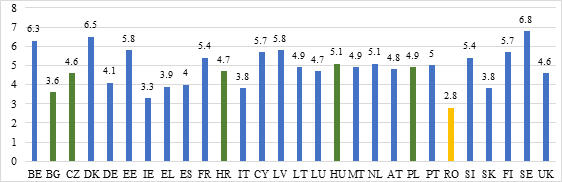
Figure 3. General government expenditure on education in EU, 2017 (% of GDP)
Notes: Romania – yellow, the other CESE-6 countries - green
Source: Eurostat, Code: gov_10a_exp
2. Private Consumption - The Main Driver of Economic Growth
The main component of the GDP in all CESE-6 countries is private consumption, with Romania having the highest level. In 2017, private consumption expenditure represented 63.1% of GDP (Eurostat, Code: tec00009), due to successive indirect tax cuts and substantial public and minimum wage hikes. In 2018, because of the deceleration in private consumption, Romania’s economic growth declined from 7% to 4.1% (Figure 4). Reality has shown that an economy that relies too heavily on consumption is more vulnerable and has difficulties in supporting long-term economic growth. Even if private consumption continues to be the main driver of growth, the confidence of Romanian consumers in the economy has started to decline. According to a study made by GfK, Germany’s largest market research institute, in 2018, Romanian consumers have not regained the confidence in the economy they had in 2017. Against the backdrop of monetary market tensions (ROBOR growth) and uncertain economic situation, the consumer climate indicator measured by GfK remains negative (-20.7), being located in the pessimism area. Only 11% of the people interviewed believe in a positive evolution of the economy and the same percentage believe that the unemployment rate will fall in the next year (Growth from Knowledge 2019).
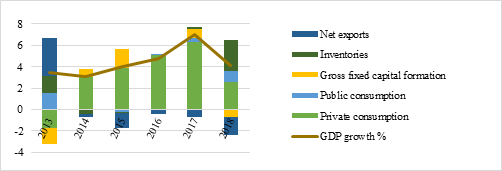
Figure 4. GDP growth and demand-side components
Source: National Institute of Statistics, Annual Gross Domestic Product
One of the reasons for the private consumption increase in Romania was the increase in wages. After years of moderate growth, starting in 2016, Romania has begun to apply one of the fastest wages increase in the EU, especially in the budget sector, putting high pressure on international competitiveness. Among the CESE-6 countries in 2018 the biggest rise in hourly labour costs in the whole economy was registered in Romania (+13.3 %), followed by and Hungary (+9.8 %) and Czechia (+8.3) (Eurostat, Code: lc_lci_lev).
Analyzing the wage structure (Figure 5), we notice that on average, the wages in the budgetary sector are significantly higher than in the private sector, which risks to discourage entrepreneurship and private work. The gap between public and private sector wages has tripled in recent years from 427 lei in 2016 to 1,422 lei in 2018. The official statistics do not include armed forces and assimilated personnel (Ministry of National Defence, Romanian Intelligence Service, Ministry of Internal Affairs etc.), so that in reality the gaps are even higher.
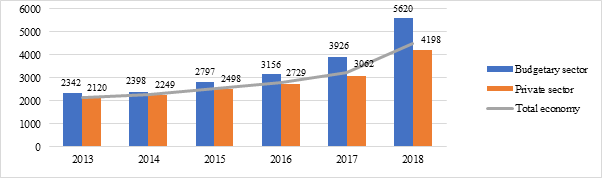
Figure 5. Gross average monthly earnings per sector
Source: National Commission for Strategy and Prognosis: Forecast of Main Macroeconomic Indicators
Increase in public and minimum wage and a low unemployment rate puts more pressure on the labour market. In 2018 the unemployment rate in Romania was 4.2%, the lowest level registered in the last decade. Except for Croatia (8.4%), all CSES-6 countries recorded lower rates than the EU-28 average of 6.8% (Eurostat, Code: tps00203). Romanian companies face a great challenge to fill job vacancies and find the relevant skills on the labour market, in the context of a high level of occupation, a declining labour force and a persistent skills shortage. Wages tend to grow, but without corresponding productivity increases, they risk putting pressure on competitiveness and affect the GDP growth.
In spite of the wages increase, in 2018, consumption has slowed and disposable income dented on the backdrop of the highest inflation in the EU. Analyzing Figure 6., we notice that in Romania, the Harmonised Index of Consumer Prices (HICP) fluctuated within a relatively wide range. This indicator measures consumer price inflation in all the countries in the European Union assessing whether a country is ready to join the euro area. The inflation rate in Romania was on a downward path until 2016 due to successive VAT cuts and low global oil prices. Since 2017, HICP started growing in most countries mainly on account of rising food prices. In Romania, the HICP reached 4.1% in 2018, significantly higher than the rest of the CESE-6 countries and more than twice the EU-28 average of 1.9%.
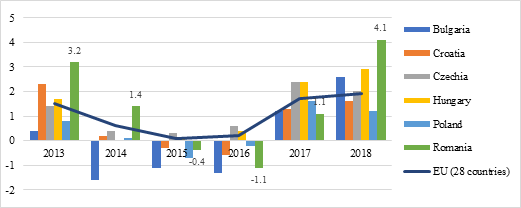
Figure 6. Harmonised Index of Consumer Prices (HICP)
Source: Eurostat, Code: tec00118
One of the convergence criteria of adopting the Euro states that a country must have an average rate of inflation (HICP) that does not exceed by more than 1.5 percentage points the rate of the three best-performing Member States in terms of price stability. At the end of 2018, the inflation reference value was 2.23% with Denmark, Ireland and Greece as the three "best-performing Member States". (values of HICP: Denmark - 0.7%, Ireland – 0.7% and Greece – 0.8%) (Eurostat, Code: tec00118). As we can see in Figure 6. among the CESE-6 countries, Romania together with Hungary and Bulgaria do not fulfill the criterion on price stability.
The 4.1% inflation rate in Romania was due to both internal and external factors. Internally, inflation accelerated as the effect of the 2017 tax cuts faded away and because of the increase in excise duty on energy products in the same year. Externally, it was due to rising food prices and, to a greater extent, energy prices. To temper the rise in prices, the National Bank of Romania (NBR) raised its monetary policy rate three times by 2018, up to 2.50%. At the same time, it raised the interest rate on the deposit facility up to 1.50% per annum and the interest rate on the lending facility up to 3.50% per annum. (National Bank of Romania 2019). The effectiveness of monetary policy measures is threatened by fiscal policy measures. The introduction of the tax on banks’ assets linked to the interbank rate (ROBOR) could affect the financial sector’s ability to finance the economy, making it unpredictable and vulnerable.
The public wage increase, together with the tax cuts contributed significantly to the increase of the public deficit, so at the end of 2018, Romania recorded the second largest public deficit in the EU after Cyprus (-4.8% of GDP). Analyzing Figure 7. we observe that since 2014, all CESE-6 countries have improved this indicator, except for Romania, which after 4 years reached the 3% of GDP limit set in the Stability and Growth Pact (SGP).
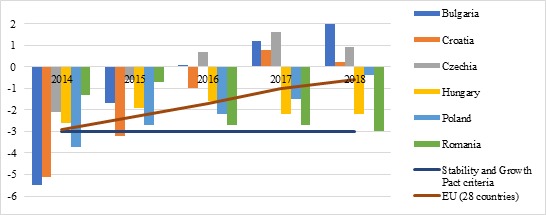
Figure 7. General government deficit, annual data (% of GDP)
Source: Eurostat, Code: teina200
Another factor that contributed to Romania’s public deficit growth was the pension increase. If until 2016 the pension point increased by about 5%/year, in 2017 it increased by 15% and in 2018 by 10% (National House of Public Pensions 2019). According to the 2017-2020 Governing Program the pension point will further increase in September 2019 by 15% and by 40% in September 2020 (Romanian Government 2017). Because of the growth in current spending, the public deficit is projected to increase further in the years to come. Against a background of a large current account deficit and higher inflation expectations, starting with September 2016, the Romanian Leu depreciated against the euro, from 4.517 in January 2016 to 4.7271 January 2019 (European Central Bank 2019).
3. Investments - A Fluctuating Evolution
In 2018, Romania’s total investment accounted for 21.2 % of GDP, slightly higher than the EU’s average of 20.5%. Amongst the CESE-6 countries, the highest percentage is registered by Czechia and Hungary (25.5% of GDP), at the opposite pole being Poland (18.2% of GDP). However, since the outbreak of the economic and financial crisis, Romania’s investment share of GDP (both from the public and private sectors) registered a downward trend. Between 2008 and 2018 it recorded the highest drop among CESE-6 countries of -16.1 percentage points. (Eurostat, Code: nama_10_an6)
Analyzing the structure of Romania’s investment, we notice that public investment accounted for less than 20% of the total. It was strong after Romania’s accession to the EU (slightly above 6% of GDP) after which the decrease began. In 2017 it reached 2.56% of GDP, the lowest level since 1999 (Eurostat, Code: sdg_08_11). While public investment decreased, starting in 2015 personnel and social assistance spending increased by 46% (Figure 8). According to the State Budget Project for 2019, social assistance spending will remain at the same rate as in 2018, but personnel spending will increase from 9% of GDP to a historic maximum of 10% of GDP. Thus, there is a great possibility in the coming years for the public investment to be further reduced, in order to keep the budget deficit below 3% of GDP.
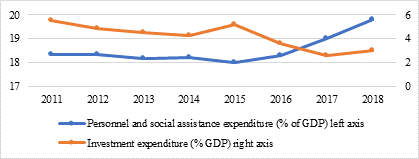
Figure 8. Expenditures of the Consolidated General Budget
Source: Ministry of Finance, Eurostat, Code: sdg_08_11
Public investment must finance infrastructure projects and other strategic areas in order to reach EU living standards in a sustainable way.Given the precarious state of the infrastructure, the government should speed up investment, not diminish it. With a total length of motorways of 763 km (Eurostat, Code: ttr00002), Romania has the lowest motorway density in the EU. It is also on the last place amongst CESE-6 countries in terms of the quality of road infrastructure (Figure 9.), having the highest road fatality rate in the EU - over 80 deaths per million inhabitants (European Transport Safety Council 2018). Romania has also very poor performance on railway services, more precisely at intensity of use, quality of service (especially punctuality), and safety. Studies show that the more a country increases investments in its railway system, the greater the improvement in the system’s performance (Duranton et al., 2017). In order to see results in the short term, it is necessary for Romania to take action as soon as possible and to make major investments in infrastructure.
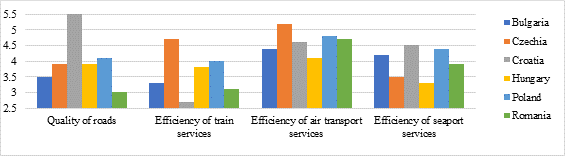
Figure 9. Quality of public infrastructure index, CESE-6 countries
Source: World Economic Forum, The Global Competitiveness Report 2018
A poor state of transport infrastructure generates higher costs for businesses as it affects shipping times and limits labour force mobility. All this may discourage investments with a negative impact on the country’s long term economic growth. In addition to infrastructure, additional investments are also required in education, healthcare, social inclusion, air pollution, energy, water and waste management infrastructure.
One of the reasons for public investment decline is the slow take-up of EU funds. The aim of European funds is to help countries invest in human capital, health, education, research / innovation, infrastructure, energy, transport, etc. These investments are meant to support the country’s long-term growth having positive implications on the population’s standard of living. As far as the absorption of European funds is concerned, in 2018 Romania’s absorption rate stands at 26%, close to the EU average of 27%. According to the former Minister of European Funds, Rovana Plumb, of the € 31 billion granted, Romania received € 7.9 billion from the European Commission (Romanian Government 2019). Despite the positive trend, access to these funds is far too slow to meet the needs of the country. Among the reasons are: limited administrative capacity to prepare and implement large investment projects, an inefficient application of public investment management rules, a lack of real prioritization, and lengthy tender procedures (European Commission 2019).
Private investment is also threatened due to concerns about fiscal and legislative instability and unpredictability. The tax measures adopted by the Ministry of Finance at the end of 2018 on the financial sector, privately managed pensions and the energy and telecommunication sector could discourage the initiative to invest. Every month, CFA Society Romania, one of the most important professional organizations comprising experts from various fields of the investment industry, develops the Macroeconomic Confidence Indicator. On the basis of a complex questionnaire, the organization aims to assess the financial analysts’ expectations regarding the economic activity in Romania for a one-year horizon. Taking values between 0 (lack of confidence) and 100 (full confidence in the Romanian economy), in January 2019 the indicator recorded 23.8 points, the lowest value since July 2012. Among the risks identified by the respondents are: fiscal policy, high uncertainty, twin deficits, economic deceleration. Even though the value of the indicator has increased slightly in the coming months, most respondents believe that business conditions in 2019 will worsen (CFA Society Romania 2019). Fiscal instability risks limiting economic growth, negatively impacting population and company confidence, investment and consumption.
The poor state of transport infrastructure and fiscal and legislative instability and unpredictability made Romania less attractive for foreign investors. Between 2013-2017 it recorded a downward trend in terms of inward foreign direct investment (FDI) stocks in percentage of GDP (Figure 10), occupying the last place among CESE-6 countries.
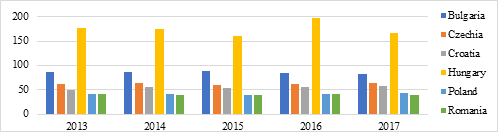
Figure 10. Inward FDI stocks in % of GDP
Source: Eurostat, tec00105
FDI is a major driver of economic growth and a major source of funding of the current account deficit. It is preferable to other sources of capital especially because the capital outflows involved - repatriation of profits - depend on the economic results obtained, responding to both the investor’s and the state’s specific interest in economic growth. Also, the indirect effects of FDI are very important, such as: boosting human capital formation, technological externalities, access to external markets etc (Moraru 2013).
Inward FDI is much needed in Romania, as the trade deficit with goods and services and the current account deficit are on an upward trend. The widening of external imbalances is due to a faster growth of imports than exports, favored by consumption-enhancing policies. Analyzing the imports structure, we observe that imports of consumer goods have increased much faster than those of capital and intermediate goods. Fiscal relaxation started in 2015 and continued in the coming years have greatly increased domestic demand, leading Romania to economic growth through consumption at the expense of growth through investments. Thus, in 2018 the trade deficit reached 7.46% of GDP (The Ministry for Business Environment, Commerce and Entrepreneurship 2019) and led to a rising current account deficit of 4.5% of GDP, the second largest in the European Union, after Cyprus (7% of GDP). Among the CESE-6 countries, Romania recorded the biggest current account deficit followed by Poland, the rest of the countries registering current account surplus (Figure 11).
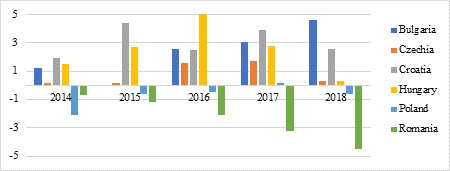
Figure 11. Current account balance - annual data
Source: Eurostat, tipsbp20
The evolution of Romania’s current account was determined by the widening of the trade balance deficit with goods. In 2018, the first 3 countries of destination for exports of Romanian goods were: Germany (with a share in Romania’s total exports of 23.0%), Italy (11.4%) and France (7.1%) (The Ministry for Business Environment, Commerce and Entrepreneurship 2019). According to the European Commission’s forecasts, the growth rate of the Eurozone, and implicitly of Romania’s main trading partners, will decrease in 2019: Germany (-0.4%), Italy (-0.8), France (-0.2) (European Commission, February 2019). Thus, these challenges of the external environment are a major risk factor for the evolution of exports in the coming years.
4. Conclusions
Between 2014-2018, Romania recorded the fastest growth rate among the CESE-6 countries (Bulgaria, Croatia, Czech Republic, Poland, Romania and Hungary). In order to achieve this performance, it embraced an economic growth model based on consumption rather than investments, which have worsened many macroeconomic indicators. Periodically, the European Commission makes a comparative analysis of CESE-6 countries to examine whether they meet the necessary conditions to adopt the euro. In the latest convergence report, from May 2018, Romania proved to be the least prepared European Union member state outside the Eurozone to adopt the single currency. Out of the four economic criteria (price stability, public finance, exchange rate and long-term interest rate levels) Bulgaria fulfils 3, Croatia 3, Czechia 2, Hungary 2, Poland 2 and Romania only 1 (European Commission, May 2018). The only criterion which, at the date of the report, Romania fulfilled, the criterion on public finances, is about to be violated in 2019. European Commission experts forecast that Romania’s general government deficit will increase at around 3.5% of GDP in 2019 and 4.7% of GDP in 2020 due to expenditure on public wages and significant increases to old-age pensions. Romania is the only country among CESE-6 which is in danger of exceeding the EU’s public deficit limit of 3 percent of GDP target. If this will happen, European Commission can launch against Romania the Excessive deficit procedure (EDP). The procedure entails several steps, potentially culminating in sanctions meant to make Romania get its budget deficit under control.The increase of the public deficit will also have negative consequences on the government debt that is likely to grow from the 35.1 % of GDP in 2018 to 38.2 % of GDP in 2020. (European Commission, 2019).
Good news is that the level of inflation that was so worrying at the end of 2018 (4.1%), is projected to decline to 3.6% in 2019, still remaining at the highest level among the CESE-6 countries. The NBR points out that the uncertainties and risks associated with the inflation outlook come mainly from administered prices, labor market conditions and the upward trend in the international oil price. Relevant are also the rhythm of economic growth and inflation dynamics in the euro area and, implicitly, the conduct of the monetary policy of the ECB and the central banks in the region (National Bank of Romania 2018). It is estimated that the positive trend will continue in 2020, when inflation will reach 3%.
The public spending which will rise in 2019 by 14%, is expected to be fully funded by revenue growth (+15.7%), sustained by rapid economic growth (+5.5% - official forecast) and improved revenue collection (Chamber of Deputies 2018). The optimistic forecast of Romanian officials is contradicted by the European Commission, which, considering the global economic context, estimates a real GDP growth of only 3.8% in 2019 and 3.6% in 2020. Economic growth may also be affected by export cuts. This may be due to the deterioration in the economic performance of the main trading partners, but also to the increase in unit labor costs, in the context of an increase in productivity lower than wages. Furthermore, tax revenues and social contributions, the main components of budget revenues, are in a slight decline. In 2017 Romania reached the lowest level in the EU after Ireland in terms of total revenue from taxes and social contributions as % of GDP and in 2016 the lowest VAT collection rate. Poor collection of taxes is due to evasion, fraud, insolvency, bankruptcy, administrative errors or legal tax optimization. Tax policy plays a key role in long-term economic growth so officials should pay more attention to this sector. Despite the recommendations made by the European Commission in 2018, there has been limited progress in enhancing tax compliance and collection (European Commission 2019).
Romania’s budget deficit increase would not be worrying if it were due to investment spending, especially in infrastructure, but it is not the case. After having recovered in 2017, investment underperformed in 2018, with a negative contribution to growth of 0.7% (Figure 4), because of weak performance in construction and a slowdown in industry. In order to have sustainable economic growth, Romania needs a predictable budget policy based on increasing public investment allocations. This can be facilitated with the help of EU funds, so the goal of the Ministry of European Funds for 2019 should be to increase the absorption rate. If it does so, it is possible for public investments to slowly recover in 2019 but private investments risk being affected by fiscal and legislative uncertainty. In 2019, in an effort to prevent the budget deficit from rising, the government introduced new taxes, such as the tax on the banks’ assets, the turnover tax for energy and telecommunications companies and the gambling industry. The unpredictability of public policies may have a negative effect on consumption and investment and ultimately hamper economic growth. Also, it may have a negative effect on the capital markets, which represent an important source of long-term investment financing.
Reality has shown that an economy that relies too heavily on consumption and neglects investment is more vulnerable and has difficulties in supporting long-term economic growth. In order to improve the performance of its macroeconomic indicators and ensure the population a living standard similar to that of the EU, Romania must shift the growth model to investment.
References
- CFA Society Romania, 2019. CFA Romania Macroeconomic Confidence Index. [online] Available at: https://www.cfasociety.org/romania/Lists/Announcements/Attachments/201/CFA%20Romania%20Macroeconomic%20Confidence%202019.pdf [Available at 18 March 2019].
- Chamber of Deputies, 2018. Report on the macroeconomic situation in 2019 and its projection for years 2020-2022, pp .20. [online] Available at: http://www.cdep.ro/pdfs/buget/2019/raport/Raport_buget_2019.pdf
- Duranton S., Audier A., Hazan J., Langhorn M. P.,and Gauche V., 2017. The 2017 European Railway Performance Index, The Boston Consulting Group. [online] Available at: https://www.bcg.com/publications/2017/transportation-travel-tourism-2017-european-railway-performance-index.aspx [Available at 18 March 2019].
- European Central Bank, 2019. ECB euro reference exchange rate: Romanian leu (RON). [online] Available at: https://www.ecb.europa.eu/stats/policy_and_exchange_rates/euro_reference_exchange_rates/html/eurofxref-graph-ron.en.html [Available at 18 March 2019].
- European Commission, 2018. Convergence Report 2018. Luxembourg: Publications Office of the European Union, pp. 6-20. [online] Available at: https://ec.europa.eu/info/sites/info/files/economy-finance/ip078_en.pdf [Available at 18 March 2019].
- European Commission, 2019. Country Report Romania. [online] Available at: https://ec.europa.eu/info/sites/info/files/file_import/2019-european-semester-country-report-romania_en.pdf [Available at 18 March 2019].
- European Commission, 2019. European Economic Forecast. Luxembourg: Publications Office of the European Union. [online] Available at: https://ec.europa.eu/info/sites/info/files/economy-finance/ip096_en.pdf [Available at 18 March 2019].
- European Transport Safety Council, 2018. Road deaths per million inhabitants. [online] Available at: https://etsc.eu/euroadsafetydata/ [Available at 18 March 2019].
- Eurostat, 2019. Code: tec00001, Gross domestic product at market prices. [online] Available at: http://appsso.eurostat.ec.europa.eu/nui/show.do?dataset=tec00001&lang=en [Available at 18 March 2019].
- Eurostat, 2019. Code: tec00009, Final consumption expenditure of households and non-profit institutions serving households. [online] Available at: http://appsso.eurostat.ec.europa.eu/nui/show.do?dataset=tec00009&lang=en [Available at 18 March 2019].
- Eurostat, 2019. Code: tec00105, Inward FDI stocks in % of GDP. [online] Available at: https://ec.europa.eu/eurostat/tgm/table.do?tab=table&init=1&language=en&pcode=tec00105&plugin=1 [Available at 18 March 2019].
- Eurostat, 2019. Code: tec00115, Real GDP growth rate – volume. [online] Available at: http://appsso.eurostat.ec.europa.eu/nui/show.do?dataset=tec00115&lang=en [Available at 18 March 2019].
- Eurostat, 2019. Code: tec00118, HICP - inflation rate. [online] Available at: https://ec.europa.eu/eurostat/tgm/table.do?tab=table&init=1&language=en&pcode=tec00118&plugin=1 [Available at 18 March 2019].
- Eurostat, 2019. Code: edat_lfse_14, Early leavers from education and training. [online] Available at: http://appsso.eurostat.ec.europa.eu/nui/show.do?dataset=edat_lfse_14&lang=en [Available at 18 March 2019].
- Eurostat, 2019. Code: gov_10a_exp, General government expenditure on education. [online] Available at: http://appsso.eurostat.ec.europa.eu/nui/show.do?dataset=gov_10a_exp&lang=en [Available at 18 March 2019].
- Eurostat, 2019. Code: lc_lci_lev, Labour cost levels. [online] Available at: http://appsso.eurostat.ec.europa.eu/nui/show.do?dataset=lc_lci_lev&lang=en [Available at 18 March 2019].
- Eurostat, 2019. Code: nama_10_an6, Gross fixed capital formation. [online] Available at: http://appsso.eurostat.ec.europa.eu/nui/show.do?dataset=nama_10_an6&lang=en [Available at 18 March 2019].
- Eurostat, 2019. Code: sdg_08_11, Investment share of GDP by institutional sectors. [online] Available at: https://ec.europa.eu/eurostat/tgm/refreshTableAction.do?tab=table&plugin=1&pcode=sdg_08_11&language=en [Available at 18 March 2019].
- Eurostat, 2019. Code: teina200, General government deficit (-) and surplus (+). [online] Available at: https://ec.europa.eu/eurostat/tgm/table.do?tab=table&init=1&language=en&pcode=teina200&plugin=1 [Available at 18 March 2019].
- Eurostat, 2019. Code: tipsbp20, Current account balance. [online] Available at: https://ec.europa.eu/eurostat/tgm/table.do?tab=table&init=1&language=en&pcode=tipsbp20&plugin=1 [Available at 18 March 2019].
- Eurostat, 2019. Code: tps00203, Total unemployment rate. [online] Available at: http://appsso.eurostat.ec.europa.eu/nui/show.do?dataset=tps00203&lang=en [Available at 18 March 2019].
- Eurostat, 2019. Code: ttr00002, Total length of motorways. [online] Available at: https://ec.europa.eu/eurostat/tgm/table.do?tab=table&plugin=1&language=en&pcode=ttr00002 [Available at 18 March 2019].
- Growth from Knowledge, 2019. Economic growth and purchasing power growth not enough to achieve consumer confidence. [online] Available at: https://www.gfk.com/ro/noutati/comunicate-de-presa/cresterea-economica-si-a-puterii-de-cumparare-nu-sunt-suficiente-pentru-a-obtine-increderea-consumat/ [Available at 18 March 2019].
- Ministry for Business Environment, Commerce and Entrepreneurship, 2019. Romania international trade. http://www.imm.gov.ro/adaugare_fisiere_imm/2019/03/RO-Comert-international-12-2018.pdf [Available at 18 March 2019].
- Ministry of Finance, 2019. Budget execution information, http://www.mfinante.gov.ro/execbug.html?pagina=buletin [Available at 18 March 2019].
- Moraru C., 2013. Foreign direct investment and economic growth in Romania. Theoretical and Applied Economics, XX, 5(582), pp. 123-133. [online] Available at: http://store.ectap.ro/articole/866.pdf [Available at 18 March 2019].
- National Bank of Romania, 2019. Monetary Policy and Standing Facilities Interest Rates. [online] Available at: https://www.bnr.ro/Monetary-Policy--3318.aspx [Available at 18 March 2019].
- National Bank of Romania, 2018. NBR Board decisions on monetary policy. [online] Available at: https://www.bnr.ro/page.aspx?prid=14737 [Available at 18 March 2019].
- National Commission for Strategy and Prognosis, 2019. Forecast of Main Macroeconomic Indicators [online] Available at: http://www.cnp.ro/ro/prognoze [Available at 18 March 2019].
- National House of Public Pensions, 2019. Evolution of the pension point value. [online] Available at: https://www.cnpp.ro/evolutia-valorii-punctului-de-pensie [Available at 18 March 2019].
- National Institute of Statistics, 2019 Annual Gross Domestic Product. [online] Available at: http://www.insse.ro/cms/ro/tags/comunicat-pib-anual [Available at 18 March 2019].
- Romanian Government, 2017. Governing Program 2017-2020. [online] Available at: http://gov.ro/fisiere/pagini_fisiere/17-06-29-08-28-44Programul-de-guvernare2017-2020-2.pdf [Available at 18 March 2019].
- Romanian Government, 2019. Press conference held by Minister of European Funds, Rovana Plumb. [online] Available at: http://gov.ro/ro/media/video/conferinta-de-presa-sustinuta-de-ministrul-fondurilor-europene-rovana-plumb&page=7 [Available at 18 March 2019].
- United Nations Development Program (UNDP), 2018. Human Development Indices and Indicators. [online] Available at: http://hdr.undp.org/sites/default/files/2018_human_development_statistical_update.pdf [Available at 18 March 2019].
- World Economic Forum, 2018. The Global Competitiveness Report. [online] Available at: http://www3.weforum.org/docs/GCR2018/05FullReport/TheGlobalCompetitivenessReport2018.pdf [Available at 18 March 2019].
Article Rights and License
© 2019 The Author. Published by Sprint Investify. ISSN 2359-7712. This article is licensed under a Creative Commons Attribution 4.0 International License.
