KeywordsEqualization Federalism Funding Paradox of revenues Solidarity Swiss Cantons
JEL Classification H20, H71, H7
Full Article
1. Introduction
Switzerland is made up of 26 Cantons, namely: Aargau, Appenzell Ausserrhoden, Appenzell Innerrhoden, Basel-Landschaft, Basel-Stadt, Bern, Fribourg, Geneva, Glarus, Graubünden, Jura, Luzern, Neuchâtel, Nidwalden, Obwalden, Schaffhausen, Schwyz, Solothurn, St. Gallen, Thurgau, Ticino, Uri, Valais, Vaud, Zug and Zürich. The funding of these Cantons is not frequently discussed in scientific literature. Nevertheless, the former system of funding has been evoked by Dafflon (2004). This system was criticized (Dafflon et al. (1996) and Swiss Federal Council (2001)) and a new system of funding came into force in 2008 that accounts for both horizontal, and vertical transfers (Soguel, 2019). Thus our research questions gravitate towards the incidence the new solidarity mechanism has on Swiss Cantons.
This article will first study the current funding mechanisms of the Swiss Cantons and place figures on the amounts they received in 2020. Then, it will measure the solidarity by calculating the differences between the amounts the Cantons have received and the ones they would have received in the absence of redistributive mechanisms.
These elements will underline the degree of solidarity in the funding mechanisms of the Swiss Cantons and will show the contributors and beneficiaries, contrasting the theoretical results of Esteller-Moré et al. (2020) indicating that solidarity – horizontal and vertical – may be diverted by pressure groups and their capacity to bend fiscal equalization. Contrarily, it confirms Aslim, and Neyapti (2017) when they argue an intermediate level of fiscal decentralization is preferrable to attain higher local welfare level, be it in the presence of spillover or not; Dmitriev, and Hoddenbagh (2019) reinforce the latter results in a monetary union where transfers accrue to the stabilization and welfare improvement functions, especially in open economies with more rigid wages. Eventually, our method is to compare pre-, and post-reform figures to highligh Canton’s wealth variation and the reform’s role towards more, or less, solidarity. In this, we follow the step of the researchers working in the fields of solidarity and federalism.
2. Funding Mechanisms
The funding of Swiss Cantons is governed by the Federal Law on Fiscal Equalization and Cost Compensation (2003), the Order on Fiscal Equalization and Cost Compensation (2007) and the Federal Order about the Cohesion Fund (2007). These legal provisions came into force on January 1, 2008. The funding includes three mechanisms, namely: Resource equalization, cost compensation and cohesion fund.
2.1 Resource Equalization - Order on Fiscal Equalization and Cost Compensation (2007)
Resource equalization in Switzerland is based on fiscal resources at the disposal of the Swiss Cantons. Cantons whose resources per inhabitant are lower than the average share a compensation which is made of two parts, one paid by the Confederation and the other paid by the Cantons whose resources per inhabitant are higher than the average. The parts are set by the Swiss Federal Assembly, but article 4 of the Federal Law on Fiscal Equalization and Cost Compensation sets out that the part of the Cantons whose fiscal resources per inhabitant are higher than the average must lie between two thirds and eighty percent of the part of the Confederation.
The contribution of each Canton whose resources per inhabitant are higher than the average is a function of the difference between its resources per inhabitant and the average and of its population. The amount received by each Canton whose resources per inhabitant are lower than the average is a function of the difference between its resources per inhabitant and the average of its population. The amounts received and paid by the Cantons as resource equalization are shown in table 1 below.
Table 1. Amounts received or paid by the Cantons as resource equalization in Switzerland (2020, million CHF)
| Canton | Resource index | Population | Amount received (+) or paid (-) |
| Zurich | 121.7 | 1 470 640 | -569.3 |
| Bern | 77.6 | 1 021 394 | 1 034.0 |
| Luzern | 89.1 | 400 279 | 135.7 |
| Uri | 71.3 | 36 520 | 54.0 |
| Schwyz | 181.3 | 154 984 | -225.4 |
| Obwalden | 115.4 | 37 329 | -10.3 |
| Nidwalden | 158.0 | 42 594 | -44.2 |
| Glarus | 70.3 | 40 423 | 62.9 |
| Zug | 249.7 | 122 779 | -328.5 |
| Fribourg | 79.2 | 307 299 | 278.3 |
| Solothurn | 72.4 | 267 432 | 371.5 |
| Basel-Stadt | 146.0 | 194 498 | -159.8 |
| Basel-Landschaft | 96.9 | 283 778 | 13.8 |
| Schaffhausen | 91.1 | 80 662 | 20.0 |
| Appenzell A.Rh. | 85.0 | 54 570 | 29.9 |
| Appenzell I.Rh. | 91.1 | 16 008 | 3.9 |
| St. Gallen | 79.5 | 501 038 | 443.5 |
| Graubünden | 82.9 | 204 436 | 137.1 |
| Aargau | 82.2 | 655 679 | 467.1 |
| Thurgau | 77.7 | 267 722 | 268.5 |
| Ticino | 96.5 | 353 562 | 21.0 |
| Vaud | 99.9 | 777 470 | 0.3 |
| Valais | 65.4 | 341 702 | 680.2 |
| Neuchâtel | 82.9 | 179 130 | 120.4 |
| Geneva | 143.7 | 484 487 | -378.9 |
| Jura | 64.9 | 72 919 | 148.5 |
| Total | 100 | 8 369 334 | 2 574.5 |
Source: Swiss Federal Finance Administration
2.2 Cost compensation- Order on Fiscal Equalization and Cost Compensation (2007)
The aim of the Swiss mechanism of cost compensation is to provide support to the Cantons which have to bear financial costs because of geo-topographic or socio-demographic factors. Two mechanisms have therefore been implemented, namely geo-topographic cost compensation and socio-demographic cost compensation.
2.2.1 Geo-Topographic Cost Compensation
The total amount allocated to the Swiss Cantons as geo-topographic cost compensation is fixed every four years by the Swiss Federal Assembly and then indexed annually according to the consumer price index. In 2020, 364.3 million CHF were allocated to the Cantons.
The total amount is divided into four parts. One third of the amount (altitude) is allocated to the Cantons whose proportion of inhabitants living above 800 metres exceeds the national average. The amount allocated to each of these Cantons is a function of its proportion and number of inhabitants living above 800 metres. One third of the amount (terrain steepness) is attributed to the Cantons whose median altitude of the productive surface area is higher than the national average. The amount attributed to each of these Cantons is a function of the median altitude of its productive surface area and of its productive surface area. One sixth of the amount (population density) is allocated to the Cantons whose proportion of inhabitants living in residential areas with less than 200 inhabitants exceeds the national average. The amount allocated to each of these Cantons is a function of its proportion and number of inhabitants living in residential areas with less than 200 inhabitants. One sixth of the amount (low population density) is attributed to the Cantons whose population density is lower than the national average. The amount attributed to each of these Cantons is a function of its population density and of its number of inhabitants. The amounts received by the Swiss Cantons as geo-topographic cost compensation are shown in table 2 below.
Table 2. Amounts received by the Cantons as geo-topographic cost compensation (2020, CHF)
| Canton | Altitude | Terrain steepness | Population density | Low population density | Total |
| Zurich | 0 | 0 | 0 | 0 | 0 |
| Bern | 1 942 727 | 1 355 864 | 20 726 702 | 3 989 426 | 28 014 719 |
| Luzern | 0 | 0 | 6 166 670 | 0 | 6 166 670 |
| Uri | 531 056 | 5 749 104 | 1 680 557 | 3 805 349 | 11 766 066 |
| Schwyz | 2 451 152 | 2 127 734 | 1 727 622 | 602 123 | 6 908 631 |
| Obwalden | 491 547 | 2 878 058 | 1 462 475 | 1 301 439 | 6 133 520 |
| Nidwalden | 0 | 534 186 | 480 716 | 282 089 | 1 296 991 |
| Glarus | 0 | 3 327 153 | 33 993 | 2 067 631 | 5 428 777 |
| Zug | 0 | 0 | 0 | 0 | 0 |
| Fribourg | 1 869 710 | 0 | 6 535 300 | 583 574 | 8 988 584 |
| Solothurn | 0 | 0 | 0 | 0 | 0 |
| Basel-Stadt | 0 | 0 | 0 | 0 | 0 |
| Basel-Landschaft | 0 | 0 | 0 | 0 | 0 |
| Schaffhausen | 0 | 0 | 0 | 0 | 0 |
| Appenzell A.Rh. | 17 508 976 | 194 758 | 2 260 351 | 0 | 19 964 085 |
| Appenzell I.Rh. | 5 142 378 | 376 851 | 2 700 826 | 398 056 | 8 618 111 |
| St. Gallen | 0 | 0 | 1 919 947 | 0 | 1 919 947 |
| Graubünden | 39 855 514 | 63 342 697 | 9 096 941 | 25 974 357 | 138 269 510 |
| Aargau | 0 | 0 | 0 | 0 | 0 |
| Thurgau | 0 | 0 | 3 599 495 | 0 | 3 599 495 |
| Ticino | 0 | 9 878 168 | 0 | 4 615 048 | 14 493 216 |
| Vaud | 73 014 | 0 | 0 | 0 | 73 014 |
| Valais | 29 187 316 | 29 576 196 | 704 153 | 15 066 392 | 74 534 057 |
| Neuchâtel | 21 471 008 | 2 105 608 | 0 | 0 | 23 576 616 |
| Geneva | 0 | 0 | 0 | 0 | 0 |
| Jura | 921 979 | 0 | 1 627 438 | 2 037 703 | 4 587 121 |
| Total | 121 446 376 | 121 446 376 | 60 723 188 | 60 723 188 | 364 339 129 |
Source: Swiss Federal Finance Administration
2.2.2 Socio-Demographic Cost Compensation
The total amount allocated to the Swiss Cantons as socio-demographic cost compensation is fixed every four years by the Swiss Federal Assembly and then indexed annually according to the consumer price index. In 2020, 364.3 million CHF were allocated to the Cantons.
The total amount is divided into two parts.
The first part, which represents two thirds of the total amount aims to compensate costs related to poverty, age and integration of foreigners. A burden index, taking into account the proportion of inhabitants who receive social assistance (poverty), the proportion of inhabitants aged over 80 years (age) and the proportion of foreigners from non-neighbouring countries (integration of foreigners) is calculated for each Canton. The Cantons whose burden index is higher than the national average share the allocated amount depending on their population and burden index.
The second part, which represents one third of the total amount aims to compensate costs related to city centres. A burden index, taking into account the size of the municipalities, their population density and their employment rate is calculated for each Canton. The Cantons whose burden index is higher than the national average share the allocated amount depending on their population and burden index. The amounts received by the Swiss Cantons as socio-demographic cost compensation are shown in table 3 below.
Table 3. Amounts received by the Cantons as socio-demographic cost compensation (2020, CHF)
| Canton | Poverty, age and integration of foreigners | City centres | Total |
| Zurich | 0 | 67 132 759 | 67 132 759 |
| Bern | 11 610 636 | 0 | 11 610 636 |
| Luzern | 0 | 0 | 0 |
| Uri | 0 | 0 | 0 |
| Schwyz | 0 | 0 | 0 |
| Obwalden | 0 | 0 | 0 |
| Nidwalden | 0 | 0 | 0 |
| Glarus | 0 | 0 | 0 |
| Zug | 0 | 0 | 0 |
| Fribourg | 0 | 0 | 0 |
| Solothurn | 3 438 499 | 0 | 3 438 499 |
| Basel-Stadt | 35 956 408 | 17 997 961 | 53 954 370 |
| Basel-Landschaft | 1 269 235 | 0 | 1 269 235 |
| Schaffhausen | 1 750 453 | 0 | 1 750 453 |
| Appenzell A.Rh. | 0 | 0 | 0 |
| Appenzell I.Rh. | 0 | 0 | 0 |
| St. Gallen | 0 | 0 | 0 |
| Graubünden | 0 | 0 | 0 |
| Aargau | 0 | 0 | 0 |
| Thurgau | 0 | 0 | 0 |
| Ticino | 14 511 245 | 0 | 14 511 245 |
| Vaud | 75 660 888 | 3 720 671 | 79 381 559 |
| Valais | 7 553 381 | 0 | 7 553 381 |
| Neuchâtel | 14 173 235 | 0 | 14 173 235 |
| Geneva | 76 295 830 | 32 594 986 | 108 890 816 |
| Jura | 672 942 | 0 | 672 942 |
| Total | 242 892 753 | 121 446 376 | 364 339 129 |
Source: Swiss Federal Finance Administration
2.3 Cohesion fund - Order on Fiscal Equalization and Cost Compensation (2007)
The Order on Fiscal Equalization and Cost Compensation provides for a mechanism called cohesion fund designed to ensure that the new system of funding does not disadvantage the poorest Cantons which will share the total amount of the cohesion fund. The cohesion fund will end in 2036. The total amount to be allocated is fixed at 365.6 million CHF per year between 2008 and 2015 and will then decrease by 5% per year. The Swiss Confederation contributes two thirds of the total amount and the Cantons contributes one third, proportionnally to their population. Therefore, each Canton contributes to the financing of the fund, but only the poorest Cantons get money from the fund as shown in table 4 below.
Table 4.Amounts received and paid by the Cantons as resource equalization in Switzerland (2020, thousand CHF)
| Canton | Population | Amount paid | Amount received | Net amount received |
| Zurich | 1 470 640 | 14 789 | 0 | -14 789 |
| Bern | 1 021 394 | 11 539 | 39 101 | 27 562 |
| Luzern | 400 279 | 4 184 | 17 769 | 13 585 |
| Uri | 36 520 | 419 | 0 | -419 |
| Schwyz | 154 984 | 1 548 | 0 | -1 548 |
| Obwalden | 37 329 | 390 | 0 | -390 |
| Nidwalden | 42 594 | 447 | 0 | -447 |
| Glarus | 40 423 | 464 | 6 127 | 5 662 |
| Zug | 122 779 | 1 189 | 0 | -1 189 |
| Fribourg | 307 299 | 2 873 | 102 960 | 100 087 |
| Solothurn | 267 432 | 2 939 | 0 | -2 939 |
| Basel-Stadt | 194 498 | 2 331 | 0 | -2 331 |
| Basel-Landschaft | 283 778 | 3 114 | 0 | -3 114 |
| Schaffhausen | 80 662 | 888 | 0 | -888 |
| Appenzell A.Rh. | 54 570 | 647 | 0 | -647 |
| Appenzell I.Rh. | 16 008 | 177 | 0 | -177 |
| St. Gallen | 501 038 | 5 432 | 0 | -5 432 |
| Graubünden | 204 436 | 2 284 | 0 | -2 284 |
| Aargau | 655 679 | 6 548 | 0 | -6 548 |
| Thurgau | 267 722 | 2 755 | 0 | -2 755 |
| Ticino | 353 562 | 3 719 | 0 | -3 719 |
| Vaud | 777 470 | 7 609 | 0 | -7 609 |
| Valais | 341 702 | 3 307 | 0 | -3 307 |
| Neuchâtel | 179 130 | 2 018 | 81 625 | 79 606 |
| Geneva | 484 487 | 4 945 | 0 | -4 945 |
| Jura | 72 919 | 818 | 14 541 | 13 723 |
| Total | 8 369 334 | 87 374 | 262 122 | 174 748 |
Source: Swiss Federal Finance Administration
3. Summary
Table 5 below summarizes the amounts received or paid by each Canton in the framework of the different funding mechanisms provided for by the Swiss law.
Table 5. Amounts received or paid by the Cantons in the framework of the funding mechanisms provided for by the Swiss law (2020, thousand CHF)
| Cantons | Resource index | Equalization | Cost compensation | Cohesion fund | Amount received (+) or paid (-) | |||
| Geo-topographic | Socio-demographic | Total | ||||||
| Zurich | 121.7 | -569 285 | 0 | 67 133 | 67 133 | -14 789 | -516 941 | |
| Bern | 77.6 | 1 034 042 | 28 015 | 11 611 | 39 625 | 27 562 | 1 101 229 | |
| Luzern | 89.1 | 135 717 | 6 167 | 0 | 6 167 | 13 585 | 155 469 | |
| Uri | 71.3 | 53 982 | 11 766 | 0 | 11 766 | -419 | 65 329 | |
| Schwyz | 181.3 | -225 364 | 6 909 | 0 | 6 909 | -1 548 | -220 004 | |
| Obwalden | 115.4 | -10 309 | 6 134 | 0 | 6 134 | -390 | -4 565 | |
| Nidwalden | 158.0 | -44 180 | 1 297 | 0 | 1 297 | -447 | -43 330 | |
| Glarus | 70.3 | 62 921 | 5 429 | 0 | 5 429 | 5 662 | 74 012 | |
| Zug | 249.7 | -328 529 | 0 | 0 | 0 | -1 189 | -329 718 | |
| Fribourg | 79.2 | 278 296 | 8 989 | 0 | 8 989 | 100 087 | 387 372 | |
| Solothurn | 72.4 | 371 529 | 0 | 3 438 | 3 438 | -2 939 | 372 029 | |
| Basel-Stadt | 146.0 | -159 773 | 0 | 53 954 | 53 954 | -2 331 | -108 149 | |
| Basel-Landschaft | 96.9 | 13 822 | 0 | 1 269 | 1 269 | -3 114 | 11 977 | |
| Schaffhausen | 91.1 | 20 026 | 0 | 1 750 | 1 750 | -888 | 20 889 | |
| Appenzell A.Rh. | 85.0 | 29 907 | 19 964 | 0 | 19 964 | -647 | 49 225 | |
| Appenzell I.Rh. | 91.1 | 3 946 | 8 618 | 0 | 8 618 | -177 | 12 387 | |
| St. Gallen | 79.5 | 443 465 | 1 920 | 0 | 1 920 | -5 432 | 439 953 | |
| Graubünden | 82.9 | 137 061 | 138 270 | 0 | 138 270 | -2 284 | 273 047 | |
| Aargau | 82.2 | 467 108 | 0 | 0 | 0 | -6 548 | 460 560 | |
| Thurgau | 77.7 | 268 482 | 3 599 | 0 | 3 599 | -2 755 | 269 327 | |
| Ticino | 96.5 | 21 036 | 14 493 | 14 511 | 29 004 | -3 719 | 46 321 | |
| Vaud | 99.9 | 322 | 73 | 79 382 | 79 455 | -7 609 | 72 168 | |
| Valais | 65.4 | 680 219 | 74 534 | 7 553 | 82 087 | -3 307 | 759 000 | |
| Neuchâtel | 82.9 | 120 417 | 23 577 | 14 173 | 37 750 | 79 606 | 237 773 | |
| Geneva | 143.7 | -378 880 | 0 | 108 891 | 108 891 | -4 945 | -274 935 | |
| Jura | 64.9 | 148 499 | 4 587 | 673 | 5 260 | 13 723 | 167 482 | |
| Total | 100 | 2 574 480 | 364 339 | 364 339 | 728 678 | 174 748 | 3 477 906 | |
Source: Swiss Federal Finance Administration
4. Solidarity
Table 6 below describes the changes in the financial position of Swiss Cantons as the funding mechanisms are progressively being introduced. The second column shows the standardized tax revenue of the Swiss Cantons which measures their wealth based on their tax revenue. The table 6 also shows the solidarity per inhabitant, which is measured by calculating the difference between the total amount per capita each Canton would receive in case of the application of an allocation key based on the standardized tax revenue and the amounts actually received.
As can be seen from table 6 below, the Swiss funding mechanisms are very redistributive and lead in some cases to a paradox of revenues. We indeed see significant differences between the resource index before funding and the resource after funding taking into account the funding mechanisms of the Swiss Cantons, namely equalization, geo-topographic cost compensation, socio-demographic cost compensation and cohesion fund.
Before funding, the index ranges from 64.9 (Jura) to 249.7 (Zug) and after funding, between 84.1 (Solothurn) and 209.9 (Zug). The greatest gap between the Cantons falls from 184.8 to 125.8. Fifteen Cantons benefit from the solidarity, for amounts between 18.1 and 2027.5 CHF per inhabitant and the other eleven finance it, with contributions between 119.3 and 3723.1 CHF per inhabitant.
Table 6. Changes in the financial position of Cantons before and after the application of the funding mechanisms (2020)
| Canton |
Resource index before funding |
Standardized tax revenue |
Population |
Standardized tax revenue /hab |
Equalization / hab |
Geo-topographic cost compensation/hab |
Socio-demographic cost compensation /hab |
Cohesion fund/hab |
Standardized tax revenue /hab after funding |
Resource index after funding |
Solidarity per inhabitant (CHF) |
| Zurich | 121.7 | 15 976 464 697 | 1 470 640 | 10 864 | -387 | 0 | 46 | -10 | 10 513 | 112.5 | -856.3 |
| Bern | 77.6 | 7 077 571 232 | 1 021 394 | 6 929 | 1 012 | 27 | 11 | 27 | 8 006 | 85.7 | 754.7 |
| Luzern | 89.1 | 3 183 514 838 | 400 279 | 7 953 | 339 | 15 | 0 | 34 | 8 341 | 89.3 | 18.1 |
| Uri | 71.3 | 232 488 019 | 36 520 | 6 366 | 1 478 | 322 | 0 | -11 | 8 155 | 87.3 | 1 492.9 |
| Schwyz | 181.3 | 2 509 811 337 | 154 984 | 16 194 | -1 454 | 45 | 0 | -10 | 14 775 | 158.1 | -2 172.2 |
| Obwalden | 115.4 | 384 839 434 | 37 329 | 10 309 | -276 | 164 | 0 | -10 | 10 187 | 109.0 | -601.5 |
| Nidwalden | 158.0 | 601 060 318 | 42 594 | 14 111 | -1 037 | 30 | 0 | -10 | 13 094 | 140.1 | -1 673.3 |
| Glarus | 70.3 | 253 757 634 | 40 423 | 6 278 | 1 557 | 134 | 0 | 140 | 8 109 | 86.8 | 1 539.0 |
| Zug | 249.7 | 2 737 602 675 | 122 779 | 22 297 | -2 676 | 0 | 0 | -10 | 19 611 | 209.9 | -3 723.1 |
| Fribourg | 79.2 | 2 172 682 361 | 307 299 | 7 070 | 906 | 29 | 0 | 326 | 8 331 | 89.2 | 932.2 |
| Solothurn | 72.4 | 1 729 786 082 | 267 432 | 6 468 | 1 389 | 0 | 13 | -11 | 7 859 | 84.1 | 1 090.2 |
| Basel-Stadt | 146.0 | 2 534 991 102 | 194 498 | 13 034 | -821 | 0 | 277 | -12 | 12 478 | 133.5 | -1 162.2 |
| Basel-Landschaft | 96.9 | 2 456 411 831 | 283 778 | 8 656 | 49 | 0 | 4 | -11 | 8 698 | 93.1 | -360.6 |
| Schaffhausen | 91.1 | 656 078 695 | 80 662 | 8 134 | 248 | 0 | 22 | -11 | 8 393 | 89.8 | -119.3 |
| Appenzell A.Rh. | 85.0 | 414 288 771 | 54 570 | 7 592 | 548 | 366 | 0 | -12 | 8 494 | 90.9 | 548.9 |
| Appenzell I.Rh. | 91.1 | 130 259 920 | 16 008 | 8 137 | 247 | 538 | 0 | -11 | 8 911 | 95.4 | 395.5 |
| St. Gallen | 79.5 | 3 556 368 224 | 501 038 | 7 098 | 885 | 4 | 0 | -11 | 7 976 | 85.3 | 547.9 |
| Graubünden | 82.9 | 1 513 425 225 | 204 436 | 7 403 | 670 | 676 | 0 | -11 | 8 738 | 93.5 | 990.7 |
| Aargau | 82.2 | 4 813 306 599 | 655 679 | 7 341 | 712 | 0 | 0 | -10 | 8 043 | 86.1 | 360.6 |
| Thurgau | 77.7 | 18 584 51 458 | 267 722 | 6 942 | 1 003 | 13 | 0 | -10 | 7 948 | 85.0 | 683.1 |
| Ticino | 96.5 | 3 046 900 475 | 353 562 | 8 618 | 59 | 41 | 41 | -11 | 8 748 | 93.6 | -270.8 |
| Vaud | 99.9 | 6 933 296 644 | 777 470 | 8 918 | 0 | 0 | 102 | -10 | 9 010 | 96.4 | -322.8 |
| Valais | 65.4 | 1 995 793 848 | 341 702 | 5 841 | 1 991 | 218 | 22 | -10 | 8 062 | 86.3 | 1 949.3 |
| Neuchâtel | 82.9 | 1 325 612 337 | 179 130 | 7 400 | 672 | 132 | 79 | 444 | 8 727 | 93.4 | 982.8 |
| Geneva | 143.7 | 6 219 119 056 | 484 487 | 12 837 | -782 | 0 | 225 | -10 | 12 270 | 131.3 | -1 164.0 |
| Jura | 64.9 | 422 558 544 | 72 919 | 5 795 | 2 037 | 63 | 9 | 188 | 8 092 | 86.6 | 2 027.5 |
| Switzerland | 100 | 74 736 441 356 | 8 369 334 | 8 930 |
Source: Swiss Federal Finance Administration, own calculation
The ranking of Cantons before and after funding is shown in table 7 and figure 1 below.
Table 7. Ranking of the Swiss Cantons in terms of resource index, before and after application of the funding mechanisms (2020)
| Before funding | After funding | ||||
| Position | Canton | Index | Position | Canton | Index |
| 1 | Zug | 249.7 | 1 | Zug | 209.9 |
| 2 | Schwyz | 181.3 | 2 | Schwyz | 158.1 |
| 3 | Nidwalden | 158.0 | 3 | Nidwalden | 140.1 |
| 4 | Basel-Stadt | 146.0 | 4 | Basel-Stadt | 133.5 |
| 5 | Geneva | 143.7 | 5 | Geneva | 131.3 |
| 6 | Zurich | 121.7 | 6 | Zurich | 112.5 |
| 7 | Obwalden | 115.4 | 7 | Obwalden | 109 |
| 8 | Vaud | 99.9 | 8 | Vaud | 96.4 |
| 9 | Basel-Landschaft | 96.9 | 9 | Appenzell I.Rh. | 95.4 |
| 10 | Ticino | 96.5 | 10 | Ticino | 93.6 |
| 11 | Appenzell I.Rh. | 91.1 | 11 | Graubünden | 93.5 |
| 12 | Schaffhausen | 91.1 | 12 | Neuchâtel | 93.4 |
| 13 | Luzern | 89.1 | 13 | Basel-Landschaft | 93.1 |
| 14 | Appenzell A.Rh. | 85.0 | 14 | Appenzell A.Rh. | 90.9 |
| 15 | Graubünden | 82.9 | 15 | Schaffhausen | 89.8 |
| 16 | Neuchâtel | 82.9 | 16 | Luzern | 89.3 |
| 17 | Aargau | 82.2 | 17 | Fribourg | 89.2 |
| 18 | St. Gallen | 79.5 | 18 | Uri | 87.3 |
| 19 | Fribourg | 79.2 | 19 | Glarus | 86.8 |
| 20 | Thurgau | 77.7 | 20 | Jura | 86.6 |
| 21 | Bern | 77.6 | 21 | Valais | 86.3 |
| 22 | Solothurn | 72.4 | 22 | Aargau | 86.1 |
| 23 | Uri | 71.3 | 23 | Bern | 85.7 |
| 24 | Glarus | 70.3 | 24 | St. Gallen | 85.3 |
| 25 | Valais | 65.4 | 25 | Thurgau | 85 |
| 26 | Jura | 64.9 | 26 | Solothurn | 84.1 |
Source: Swiss Federal Finance Administration
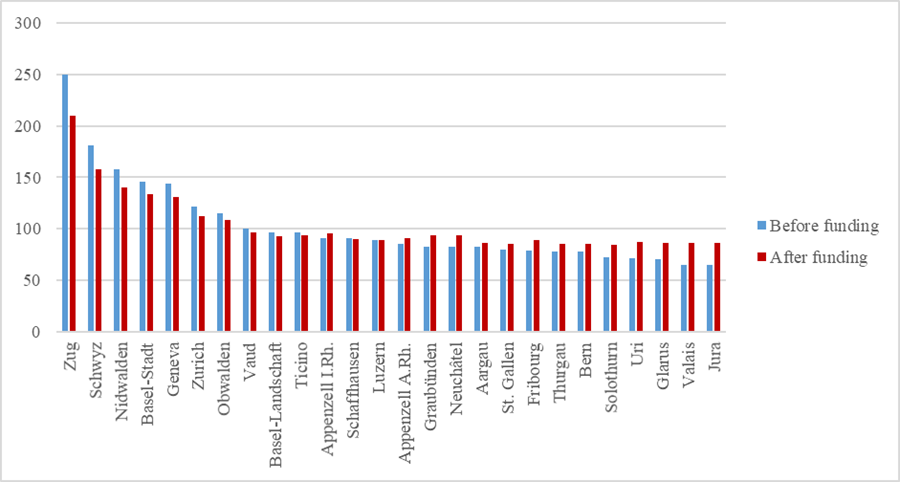
Figure 1.Ranking of the Swiss Cantons in terms of resource index, before and after application of the funding mechanisms (2020)
Source: Swiss Federal Finance Administration
The changes in the ranking of Cantons before and after funding allow us to conclude on the presence of a paradox of revenues, in addition to solidarity. Indeed, sixteen of the twenty-six moved in the ranking, while the other ten did not. The eight richest Cantons did not move in the ranking. The largest changes were experienced by St. Gallen which fell six places, going from the eighteenth to the twenty-fourth place, and by Jura which gained six places, moving from the twenty-sixth to the twentieth place.
5. Conclusion
The purpose of our paper was to explain the funding mechanisms of Swiss Cantons and to calculate to what extent they create solidarity and influence the wealth of Cantons. Our analysis enabled us to see that the Swiss system of funding is redistributive and even leads to a paradox of revenues in some cases. This paradox could be reasonable for the aim of relaunching the economy of the poorest Cantons. Additionally, this situation is not an isolated one. Such a paradox of revenues was observed in Canada (Vandernoot, 2014 – a, and b), Belgium (Pagano, Vandernoot and Tyrant, 2011) and in Spain (Bellanca, Martinez Sans & Vandernoot, 2013).
Further research could study the financial flows between the Swiss Cantons on longer periods in order to calculate the cumulative effect of this phenomenon. Indeed, our analysis focus on one year, but serial data would provide better insight in trends and emerging patterns in the Swiss context of solidarity reform. Eventually, transfers might weaken the welfare-improvement effect as Gross (2021) theoretically states.
References
- Aslim, E. G. and Neyapti, B., 2017. Optimal fiscal decentralization: Redistribution and welfare implications. Economic Modelling, 61, pp. 224-234
- Bellanca, S., Martinez, M. and Vandernoot, J., 2013. The Solidarity in the Spanish Funding of the Autonomous Communities. International Business Research , 6 (5), pp. 45-54.
- Dafflon, B., Frey, R., Jeanrenaud, C., Meier, A. and Spillmann, A., 1996. La péréquation financière entre la Confédération et les cantons en Suisse. Annuaire des collectivités locales, 16, pp. 63-99.
- Dafflon B., 2004. Federal-Cantonal Equalization in Switzerland: An Overview of the Reform in Progress. Public finance and management, 4 (4), pp. 521-558.
- Dmitriev, M. and Hoddenbagh, J., 2019. Optimal fiscal transfers in a monetary union. Journal of International Economics, 17, pp. 91-108
- Esteller-Moré, A., Galmarini, U. and Rizzo, L., 2017. Fiscal equalization and lobbying. International Tax and Public Finance, 24, pp. 221-247
- Federal Law on Fiscal Equalization and Cost Compensation, 3 Oct. 2003.
- Federal Order about the Cohesion Fund, 22 Jun. 2007.
- Gross, T., 2021. Dynamic optimal fiscal policy in a transfer union. Review of Economic Dynamics, 42, pp. 194-238.
- Ladner A., Soguel N., Emery Y., Weerts S., Nahrath S. (eds), 2019. Swiss Public Administration – Making the State Work Successfully. Governance and Public Management. Cham: Palgrave Macmillan.
- Order on Fiscal Equalization and Cost Compensation, 7 Nov. 2007. Available online at: https://www.fedlex.admin.ch/eli/cc/2007/792/fr (accessed 15 May 2014)
- Pagano, G., Vandernoot, J. and Tyrant, T., 2011. Vingt ans de solidarité entre les entités fédérées (1989-2009). Courrier hebdomadaire du CRISP, 2122, pp. 1-39.
- Soguel, N., 2019. Intergovernmental Fiscal Transfers and Equalization., pp. 291-305. in: Ladner et al., 2019
- Swiss Federal Council, 2001. Federal Council’s Opinion on the new financial equalization programme.
- Vandernoot, J., 2014a. Funding of Canadian Provinces, Mechanisms and Solidarity. Advances in Management and Applied Economics, 4 (6), pp. 29-38.
- Vandernoot, J., 2014b. Funding of German Lander, Mechanisms and Solidarity. Research in Applied Economics, 6(2), pp.1-17.
Article Rights and License
© 2021 The Authors. Published by Sprint Investify. ISSN 2359-7712. This article is licensed under a Creative Commons Attribution 4.0 International License.
